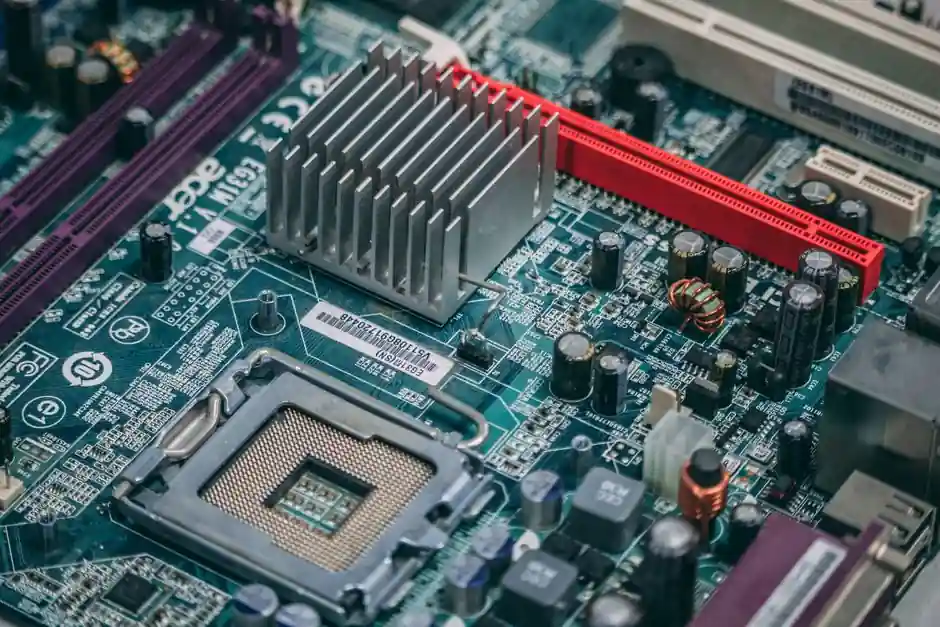
Sub-2 nm backside power can improve power performance by 20–30%, while 800 V DC distribution can reduce current, busbar losses, and copper requirements [S3][S4].
2 nm processors will not deliver an automatic facility-wide efficiency jump: AI accelerators can exceed 1,400 W per chip, and rack power density could approach 1 MW by 2030 [S5][S6].
What 2 nm changes at the silicon level
Smaller transistors can reduce switching energy and allow more logic to fit on a die, but power savings do not automatically produce a proportional increase in performance. A reported comparison between NVIDIA H100 and B200 illustrates the trade: 80 billion transistors, 3 TB/s, and 700 W for H100 versus 208 billion transistors, 9 TB/s, and more than 1,000 W for B200, a threefold performance gain for a 42% power increase [S3].
Backside power is the major architectural change at sub-2 nm. Instead of relying on one face of the wafer for both signal and power routing, the power network can be moved behind the transistor layer, reducing routing congestion and improving power delivery. The estimated improvement is 20–30% in power performance, not 20–30% in data center electricity consumption [S3].
Chiplets extend the same efficiency strategy at package level. Moving SRAM off the processor die can shorten electrical paths to memory and reduce the heat associated with long on-chip routes, while hybrid bonding can reduce interconnect pitch and increase wiring density in three-dimensional packages [S3]. Photonic links can also cut the power and heat associated with moving data over copper, although chip-to-chip photonics remains less mature than conventional electrical interconnects [S3].
48 V racks versus 800 V DC distribution
The main data center comparison is between conventional 48 V rack buses and higher-voltage distribution at 800 V DC. The 48 V architecture is familiar, widely supported, and falls below safety extra-low-voltage limits, but it carries more current for the same power, increasing conductor size, voltage drop, and resistive loss [S4].
Moving AC conversion to the building edge or end of a rack row allows a higher-voltage DC bus to travel farther before final conversion. The design target remains lower voltage at the processor, commonly 0.8 V, 1 V, 3 V, or 6 V, but a higher voltage and lower current between the rack and board [S2]. In the cited architecture, a first stage converts 48 V to 12 V or sometimes 6 V, and a second stage uses DrMOS devices to reach the processor voltage [S2].
For AI servers, converter complexity is already substantial. A GH200 board uses 19 DrMOS devices for Grace and 56 for Hopper, while GB200 uses 19 for Grace and 130 for Blackwell [S2]. Higher upstream voltage can reduce distribution loss, but the processor still requires high-current, low-voltage conversion placed close to the load [S2][S4].
Where the efficiency gain is realized
2 nm efficiency begins at the transistor and package, but the facility benefit depends on the conversion chain from grid to chip. That chain includes utility-connected AC/DC conversion, backup systems, intermediate buses, rack power supplies, board-level DC/DC converters, and the final processor regulator [S4].
Each conversion stage adds losses, magnifies component count, and creates thermal load. A facility team evaluating 2 nm hardware should therefore separate three measurements: watts per chip, efficiency from rack input to processor, and facility power usage effectiveness. A processor that consumes less power per operation can still produce a modest facility gain if cooling, networking, storage, and conversion losses remain unchanged.
Final DC/DC conversion must remain close to the load to limit voltage drop and interference from connection inductance while handling processor load transients. Placing conversion electronics beside the chip also creates a thermal problem in rack spaces where the cooling system is already constrained [S4]. This makes the 2 nm transition a power-design project, not just a silicon-node project.
For measurement and commissioning, a power-quality analyzer can establish the input baseline, while a power meter can separate load changes from conversion losses. Neither instrument can identify a 2 nm node directly; they provide the electrical evidence needed to separate real efficiency gains from workload changes.
Rack density can absorb the chip-level gain
AI workloads are moving faster than server efficiency because accelerator power and rack density are rising. Next-generation processors are expected to exceed 1,400 W per chip, requiring power systems designed around higher-density loads [S6]. Rack power could reach 1 MW by 2030, increasing the importance of power delivery, cooling, and conversion efficiency [S5].
This creates a straightforward comparison. A 20–30% improvement in chip-level power performance [S3] reduces watts per unit of work, but a 42% increase in chip power between two reported accelerator generations [S3] can offset that benefit at system level. Higher node efficiency also loses relative value when operators add more accelerators per rack to serve more concurrent inference and training work.
At facility scale, the practical result depends on utilization. A lightly loaded 2 nm accelerator may deliver excellent efficiency per computation, while a rack operating near its power ceiling remains constrained by conversion stages, busway losses, and heat rejection. Operators should specify for worst-case rack power, not average silicon power, and should preserve the margin needed for transients and redundancy.
Cooling becomes part of electrical efficiency

Backside power can improve chip power performance, but the power-delivery network still dissipates energy as heat. A 48 V bus requires more current and more copper than an 800 V DC bus for the same load, and final converters must be installed close to processors to manage voltage drop and transient response [S2][S4].
Higher rack density also increases the heat that must be removed. The cited 1 MW rack projection and the sub-2 nm transition can therefore reinforce each other: denser packaging improves compute efficiency, while the concentrated power delivery network raises the thermal load per rack [S5]. Cooling infrastructure must remove the losses from converters, memory, networking, and processors, not only the heat from the transistor active area.
Data center operators should compare 48 V and 800 V DC options on full-system criteria: distribution loss, copper volume, converter efficiency, thermal location, personnel safety, certification effort, and component supply. The 800 V route offers lower current and smaller conductors, but it carries stricter insulation, galvanic-isolation, certification, and personnel-access requirements [S4].
Limitations and implementation checks
Backside power does not remove the need for board-level conversion, and 2 nm does not make cooling irrelevant. The 20–30% estimate is a potential improvement in power performance for the chip architecture, not a guaranteed reduction in facility electricity [S3]. A design must still account for 1,000 W-plus accelerators, 1,400 W-plus next-generation processors, and rack densities approaching 1 MW [S3][S5][S6].
Higher-voltage distribution also creates qualification work. Moving from 48 V to 800 V DC requires different insulation, isolation, certification, and service procedures, so component maturity and system safety must be evaluated together [S4]. Regulated and unregulated intermediate buses introduce another trade-off: isolated, unregulated designs can improve efficiency and power density, but downstream converters must be selected for compatibility [S4].
The most defensible implementation sequence is to establish a measured facility baseline, qualify the higher-voltage power path, verify final conversion close to the processor, and then measure full workload efficiency. A data logger can retain power, temperature, and workload data for that comparison, while a digital multimeter supports bench validation of input voltage, current, and conversion stages.
Track three signals through procurement and commissioning: processor watts per completed workload, watts per rack delivered to the IT load, and facility PUE under the same utilization profile. If 2 nm gains are absorbed by higher accelerator density, the first metric may improve while the second and third change little.