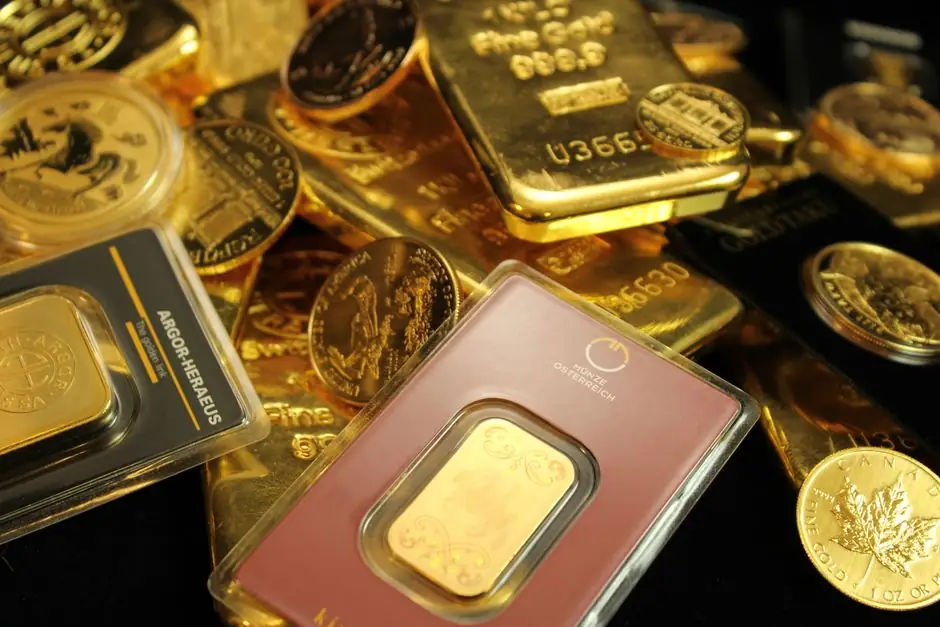
There is credible evidence of a cyclical commodity upswing in 2026, but not of a synchronized boom across all raw materials.
The distinction matters for buyers and investors: energy, strategic metals, gold and crude oil face different supply constraints, demand paths and price signals, with more than $700 billion of commodity-sector capital expenditure expected in 2026 [S1].
A broad cycle, but a fragmented commodity upswing
The average IA Commodity/Natural Resources sector fund rose 29.5% over 2025, with the WS Amati Strategic Metals Fund gaining 162.1% [S3].
The 2025 performance was concentrated rather than uniform: strategic-metals funds posted triple-digit gains, including 162.1% for the WS Amati Strategic Metals Fund, while copper and silver were identified as areas relevant to electrification, electric vehicles and photovoltaics [S3]. Gold and crude oil followed different paths in 2026, with gold functioning as a store of value while oil faced a combination of geopolitical risk and supply uncertainty [S4].
This structure does not meet a single-price test for a commodity supercycle. A supercycle requires sustained, broad-based commodity price strength generated by demand exceeding available supply over an extended period, rather than a short rally led by one geopolitical event or a few strategic materials [S3].
Four structural forces behind the 2026 debate
The energy transition requires materials for power networks, electric vehicles and photovoltaic systems. Copper supports electrification and power-intensive infrastructure, while silver is used in electric vehicles and photovoltaics; rare earth metals are important components in electronics [S3].
Capital spending strengthens the cycle case
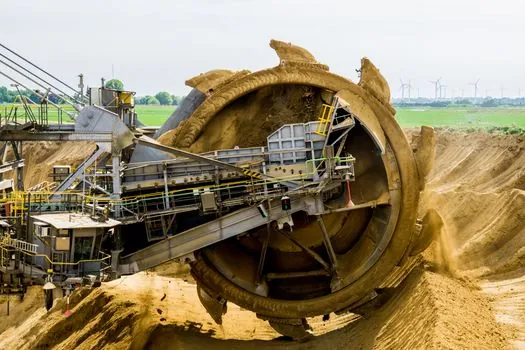
The commodity sector is expected to spend more than $700 billion on capital expenditure in 2026 alone [S1]. More than $700 billion in commodity-sector capital expenditure is expected in 2026 [S1].
Energy has the strongest near-term signal
This is the clearest near-term cyclical signal in the supplied evidence, but its cause differs from the structural expansion of copper and strategic metals.
Critical metals offer stronger structural exposure
Strategic metals provide a more coherent electrification-led case than a single oil-price rally. Copper is required for electrification and power-intensive infrastructure, silver serves electric-vehicle and photovoltaic applications, and rare earth metals are used in electronics [S3].
Three criteria distinguish this group from gold and crude oil. First, demand is linked to specific capital projects rather than broad monetary sentiment. Second, supply is constrained by permitting, construction lead times, ore grades and processing capacity. Third, government policy is explicitly supporting domestic supply chains, refining and processing rather than focusing only on raw material extraction [S3].
The comparison is specific: critical metals score higher on structural demand visibility and processing-policy support, crude oil scores higher on immediate geopolitical price sensitivity, and gold performs more as a store of value than as an industrial-demand exposure [S3][S4]. None of these rankings predicts annual returns, and each commodity remains exposed to substitution, inventory cycles, project delays and policy changes.
Who should use this framework, and who should not
Industrial procurement teams, project developers and commodity traders can use the supercycle framework to stress-test delivery schedules, contract structures and inventory exposure. Those facing long-lead electrical equipment, refined metals or energy logistics should distinguish temporary price spikes from persistent capacity constraints [S3].
The framework is less suitable for treating one price chart as a universal cycle signal or for making a binary forecast across unrelated commodities. A manufacturer exposed to copper inputs cannot assume the same demand or supply conditions apply to natural gas, and a consumer exposed to gold prices cannot infer the same conditions for rare earths [S2][S4].
The 2026 metals and energy price index signals for buyers is the relevant companion analysis for separating buyer-relevant price movement from broader market commentary. The evidence supports scenario planning by commodity and contract horizon, not a single portfolio-wide conclusion.
What would confirm or disprove the supercycle thesis
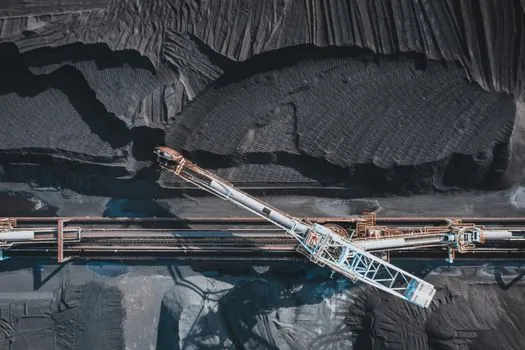
A stronger confirmation would require broad price strength across several commodity groups, sustained capital spending above the $700 billion 2026 expectation, and supply growth that lags demand as electrification, AI infrastructure and defense-related procurement expand [S1][S2].
Three failure modes would weaken the thesis. The first is a reversal in energy prices that exposes the recent leadership as primarily geopolitical. The second is demand destruction or project delays in AI, power-grid, vehicle and photovoltaic investment. The third is faster-than-expected supply growth from the capital projects already being funded, which would convert high spending into oversupply rather than sustained pricing power [S1][S3].
There is also a policy risk in both directions. Resource nationalism can accelerate domestic refining and supply investment, but trade barriers and geopolitical fragmentation can also constrain the movement of finished materials and raise duplication costs [S3].
Bottom line for the 2026 supercycle question
Yes, a commodity upswing is underway in 2026, but calling it a single supercycle overstates the evidence. Energy has the clearest immediate price signal, strategic metals have the strongest structural demand case, and gold is following a separate store-of-value role [S3][S4].
The trackable test is breadth and duration: sustained gains across more commodities, continued capital expenditure, constrained physical supply and end-use demand that survives the reversal of any single geopolitical shock. Until those conditions align, the defensible view is a fragmented, multi-driver cycle rather than a uniform commodities boom.