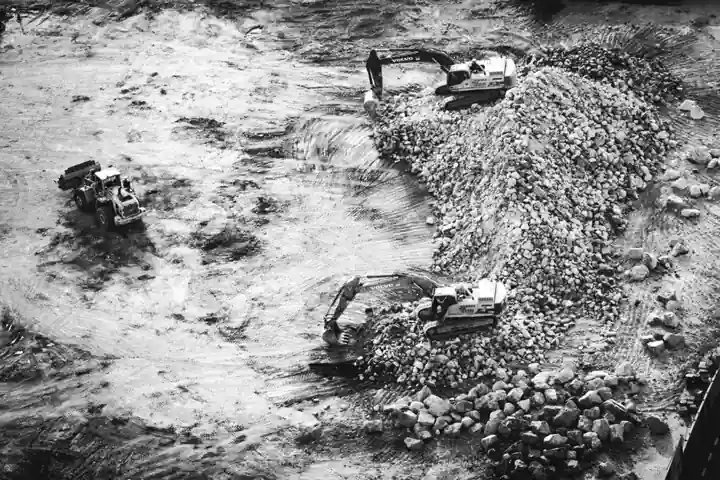
Using data reported between 2021 and 2026, the study reports estimates of 0.9 and 1.6 million tonnes per year of cathode-grade copper [S2].
U.S. pipeline scale and definition
The study reports estimates of 0.9 and 1.6 million tonnes per year of cathode-grade copper using data reported between 2021 and 2026 [S2]. The estimate was compiled from technical reports and mine-level productivity pathways, including diesel, electricity, water and tailings factors used in life-cycle assessment databases [S2].
That distinction matters because announced resource, reserve and processing-capacity figures are not interchangeable.
The study reviews diesel, electricity, water, and tailing-waste generation factors reported in the literature and used in life-cycle assessment databases [S2].
Chile supplies the largest named expansion slate
Chile’s 13-project slate carries $14.8 billion of announced value, with seven developments targeting operations in 2026 and planned additions of almost 500,000 tonnes of annual capacity backed by $7.1 billion of investment [S4]. Another six projects were scheduled to begin construction, representing $7.7 billion of spending [S4].
The operating slate includes Collahuasi C20+, Rajo Inca, Mantos Blancos and Dominga, while the construction slate includes BHP’s Spence and Capstone’s Santo Domingo [S4]. C20+ is intended to extend Collahuasi’s operating life by 20 years [S4].
Several Chilean projects are scheduled to begin producing in 2026, but they will not achieve full ramp-up immediately [S4].
Development-stage projects expose the capacity gap
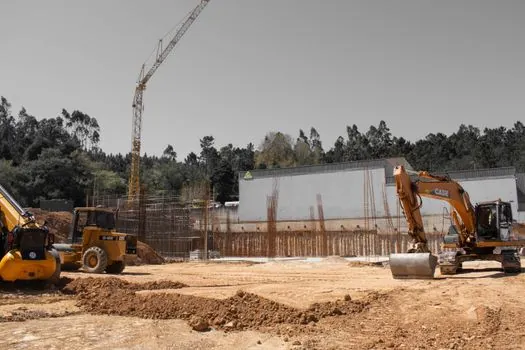
Resolution Copper presents an upper-bound resource case of up to 40 billion pounds of copper over an operating life of as much as 40 years, potentially supplying up to 25% of U.S. copper requirements [S6].
Ivanhoe Electric’s Santa Cruz project is designed to produce 99.99% pure copper cathode over a 24-year mine life, with 1.5 million tonnes of contained copper identified in reserves [S7].
Its processing rate establishes a plant-throughput benchmark, not mine output, because grade, recovery, dilution and mine availability determine the contained copper produced from that feed [S9].
Capacity comparison: announced output versus deliverability
On announced annual capacity, Chile’s 2026 operating slate offers about 500,000 tonnes, while the broader U.S. proposed-project pool totals 1.6 million tonnes per year [S2][S4]. On near-term deliverability, the Chilean slate benefits from projects already scheduled for construction or operation, whereas Resolution carries litigation uncertainty, Santa Cruz remains development-stage, and Copperwood’s daily rate requires conversion through grade and recovery [S5][S6][S7][S9].
Average global copper ore grades have fallen 40% since 1991, the capital intensity of expanding an existing mine has risen 65% since 2020, and discovery-to-production lead times average about 17 years [S5]. These constraints make project announcements a long-duration supply signal rather than a substitute for operating capacity.
Argentina extends the multi-year pipeline
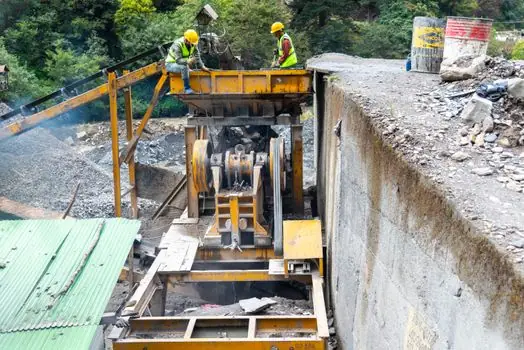
Argentina’s nine-project copper pipeline could exceed 1.5 million tonnes of production by 2035 [S8]. The 2035 horizon places the proposed output well beyond the 2026 construction window and separates it from projects capable of affecting near-term concentrate and cathode supply [S8].
The combined American and South American pipeline therefore spans very different time scales: the 500,000 tonne annual Chilean expansion targets 2026, the 1.6 million tonne annual U.S. proposed pool spans active and proposed assets, and Argentina’s potential exceeds 1.5 million tonnes by 2035 [S2][S4][S8].
For procurement and infrastructure planning, annual output should be cross-checked against construction status and route to market. Conventional sulphide mines require concentrator and smelter logistics, while in-situ or heap-leach operations shift the emphasis toward water, reagent handling and cathode production [S2].
Sourcing, standards and project execution
Capacity estimates should be taken from technical reports and project disclosures, then classified by stage, ownership share, reserve or resource basis, throughput and annual copper output [S2][S5]. The 2026 U.S. company comparison identifies proven and probable reserves as “R” and measured and indicated resources as “M”, with attributable ownership shares marked separately [S5].
That reporting discipline is essential for a project such as Resolution Copper. Its 40 billion pound potential and 25% U.S. supply share are large scenario indicators, but the unresolved legal position excluded it from modeled production cases [S5][S6]. For Santa Cruz, the 24-year life and 99.99% cathode specification describe design intent, not a guaranteed 2026 supply rate [S7].
Closing the pipeline requires more than adding nameplate capacity. The United States needs 0.9 million tonnes per year from active projects and 1.6 million tonnes per year from proposed projects to reach the full analyzed pipeline, while 21% of that new output uses leaching and avoids offshore concentrate smelting [S2]. The decision-grade signals are construction completion, project-level throughput, grade, recovery, financing, permitting, water and power availability, and contracted concentrate or cathode logistics.