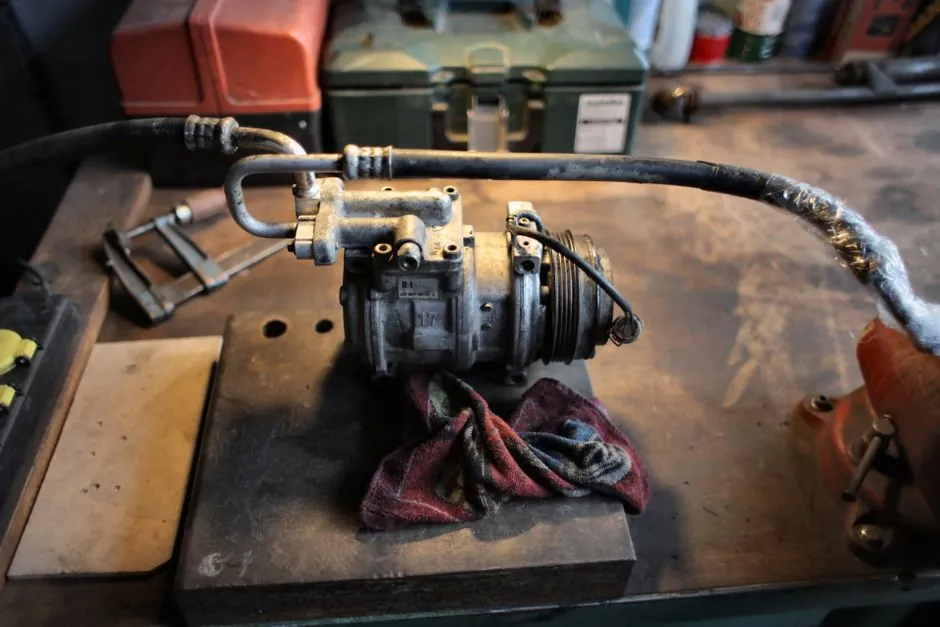
The global air compressor market is projected at USD 35.21 billion in 2026, advancing at a 4.61% CAGR to USD 44.11 billion by 2031, per Mordor Intelligence's January 2026 update [S1]. A separate HDIN Research outlook published 2026-03-24 values the equipment-only market at USD 10-15 billion for 2026 with a 2.8-4.8% CAGR through 2031, a lower band that excludes aftermarket services and rentals [S2]. Both numbers point to the same direction: mid-single-digit growth, not a boom, but a structural re-mix toward higher-power and oil-free architectures.
Compressed air powers roughly 92% of all U.S. industrial sectors and accounts for an estimated 9.5-12% of China's national electricity generation [S2]. That utility-grade footprint is what turns a slow-growth equipment market into a hot software-and-service market, and it is the lever the top four suppliers are pulling hardest.
Market Sizing and Segment Split: Where the Dollars Sit in 2026
By operating principle, positive displacement compressors captured 65.3% of 2025 revenue, while dynamic designs (centrifugal, axial) are forecast to grow at a 5.3% CAGR through 2031, the fastest slice inside the principle segmentation [S1]. By technology, oil-flooded units still held 61.8% share in 2025, yet oil-free variants are projected to expand at 5.2% CAGR to 2031, the strongest growth pocket in the technology axis [S1]. Stationary units led 2025 with 64.1% revenue share; portable units are forecast at 4.9% CAGR [S1].
Power-rating distribution is where 2026 buyer intent shows up most clearly: 101-300 kW machines took 39.4% of 2025 revenue, while units above 500 kW are set to grow at 5.8% CAGR, the strongest of any rating band, driven by LNG, hydrogen, and CCUS mega-projects [S1]. By end user, manufacturing held 42.5% of 2025 revenue, and healthcare is the fastest-growing vertical at 7.4% CAGR through 2031 [S1]. Asia-Pacific commanded 43.7% of 2025 revenue, with North America and Europe combined at roughly 45% [S1]. The U.S. market alone was valued at USD 3.96 billion in 2024 and is projected to reach USD 5.29 billion by 2033 at a 3.56% CAGR, per Custom Market Insights, 2026-07-05 [S6].
Competitive Landscape: Four Tiers, Not One Market
The supplier field splits into four working tiers. Tier 1, the global majors: Atlas Copco, Ingersoll Rand, Siemens Energy, and Kaeser jointly controlled about 35-40% of 2025 global sales [S1]. HDIN Research adds Hitachi and Elgi to this top tier of "robust market share" players [S2]. Tier 2 is the Chinese disruptors, with Kaishan Group explicitly named as expanding its global footprint through competitive pricing and rapid VSD+IIoT feature adoption [S2]. Tier 3 is regional specialists and OEM private-label builders serving 7-100 kW shop-air customers. Tier 4 is the long tail of import and replacement-rotor shops.
Consolidation is the dominant M&A signal. Suppliers are buying bolt-on digital and service assets rather than greenfield capacity, and the same suppliers that capture the 500+ kW mega-project demand also lock in multi-year service contracts on the installed base [S1]. For a buyer comparing an air pick pneumatic tool spec to the compressor feeding it, the practical takeaway is that Tier 1 service density usually beats Tier 2-3 first cost over a 10-year lifecycle.
Selection Criteria: Match the Spec Tier to the Process Demand

Selection in 2026 starts with four non-negotiable filters, in this order: pressure class, air quality class (ISO 8573-1), duty profile (base load vs variable), and total kWh/1000 Nm³ at the working pressure.
Duty profile determines drive topology. Plants with demand swings above 30% of nominal should specify variable-speed drive (VSD) screw or centrifugal staging; flat baseload applications still favor fixed-speed oil-flooded screw at the lowest $/kW delivered. The 101-300 kW band is the most contested on first cost, while 500+ kW units are increasingly sold as engineered skids with heat-recovery and air-treatment packages, not as standalone machines [S1]. Cooling choice is the secondary filter: air-cooled units held 78.2% of 2025 sales, but water-cooled systems grow at 5.1% CAGR where heat-recovery justifies the loop cost [S1].
Technology Comparison: Oil-Flooded Screw vs Oil-Free Screw vs Centrifugal vs Reciprocating
On the four decision criteria that drive 2026 buying, here is how the dominant platforms line up. Oil-flooded rotary screw: lowest first cost, widest service network, highest kWh/1000 Nm³ unless paired with VSD, not suitable for ISO 8573-1 Class 0. Oil-free screw (water-injected or dry): 20-40% first-cost premium, Class 0 capable, suited to pharma, semiconductor, food, medical; maintenance cost roughly 1.3-1.8x oil-flooded per hour. Centrifugal: best part-load efficiency above 350 kW, lowest oil carryover in dynamic designs, highest installed footprint, used heavily in LNG and CCUS. Reciprocating (piston) compressors are projected at a $7.2 billion market size in 2026, growing at 4.2% CAGR to $9.6 billion by 2033 [S7].
The same logic extends downstream. An air impact wrench rated for 6.3 bar shop air behaves very differently when fed by an 8 bar fixed-speed oil-flooded package versus a 7 bar trim VSD oil-free unit, especially in duty cycle and moisture load. Spec the compressor first, then the tool, not the other way around.
Use-Case Map: Who Should Buy What in 2026

Process plants in chemicals, food, pharma, and electronics should default to Class 0 oil-free screw or centrifugal, with heat-recovery where the host site has a low-pressure steam or hot-water demand. Discrete manufacturing (auto, machinery, metal fab) typically stays on oil-flooded VSD screw at 7-13 bar. Energy and infrastructure buyers in LNG, hydrogen, and CCUS should look above 500 kW, where dynamic compression, multi-stage staging, and engineered-skid packaging dominate [S1]. Healthcare expansion, the fastest-growing end-user vertical at 7.4% CAGR through 2031, pulls demand for medical-air systems and oil-free scroll packages [S1].
Stationary installations lead 2025 with 64.1% share, but portable units grow at 4.9% CAGR on construction and rental fleet demand [S1]. Reciprocating units, valued at USD 7.2 billion in 2026, remain the workhorse of high-pressure intermittent duty in service shops and small fabrication [S7]. For an operations manager weighing air quality monitor placement downstream of the package, the right compressor class is the upstream decision: a dirty or wet supply ruins even a well-specified monitor.
Limitations, Failure Modes, and Sourcing Risks
Three constraints cap how fast the headline growth can translate into installed capacity. First, raw-material volatility, especially steel, copper, and electric motor lamination steel, swings compressor BOM cost 6-12% quarter to quarter, distorting bid comparisons. Second, grid instability in emerging markets caps the real-world use of high-power VSD units, since harmonics and voltage sag shut down sensitive drives. Third, a shortage of advanced rotor-design engineers (the people who can model two-phase flow in oil-free screws) is a hard ceiling on how fast new Tier 2 capacity comes online [S1].
For buyers sourcing from Chinese suppliers, the 2026 Guangzhou market commentary from PR Compressor notes that energy costs have risen approximately 8-15% annually, which compresses the first-cost advantage of budget oil-flooded units once two years of duty are paid for [S8]. Warranty terms and IIoT data ownership also diverge sharply between Tier 1 majors (typically 5-10 year package warranties with data export) and Tier 2/3 builders (1-2 years, data often locked to vendor cloud). Always require ISO 8573-1 cleanliness certification traceable to the test method, not just a "Class 0" label.
Standards, Sourcing, and Where the Market Goes Next

Three standards shape the 2026 buying checklist more than any others. ISO 8573-1 governs compressed-air purity classes and is the de facto filter for oil-free and medical-air claims. IEC 60079-x governs the explosion-protected variants that show up in oil-and-gas and chemical plants; any compressor going into a Zone 1 or Zone 2 area needs the right Ex rating on the motor and terminal box. ATEX 2014/34/EU mirrors the IECEx framework for European installations. The EU Ecodesign directives for industrial fans and air compressors remain the strictest regulatory push, which is why Europe trails only APAC in replacement-cycle demand [S1][S2].
Next signals to track: oil-free share of new orders, where the inflection from 5.2% CAGR growth [S1] should show up first in 7-15 kW shop-air packages; 500+ kW order books, where LNG and hydrogen CAPEX decisions are pulled forward; and the gap between Mordor's USD 35.21 billion 2026 number [S1] and HDIN's USD 10-15 billion equipment-only band [S2], which is the size of the aftermarket and service revenue the top four are fighting to own. A useful cross-reference on which suppliers are actually capturing that revenue sits in the 2026 ranking of air compressor manufacturers and their market share.