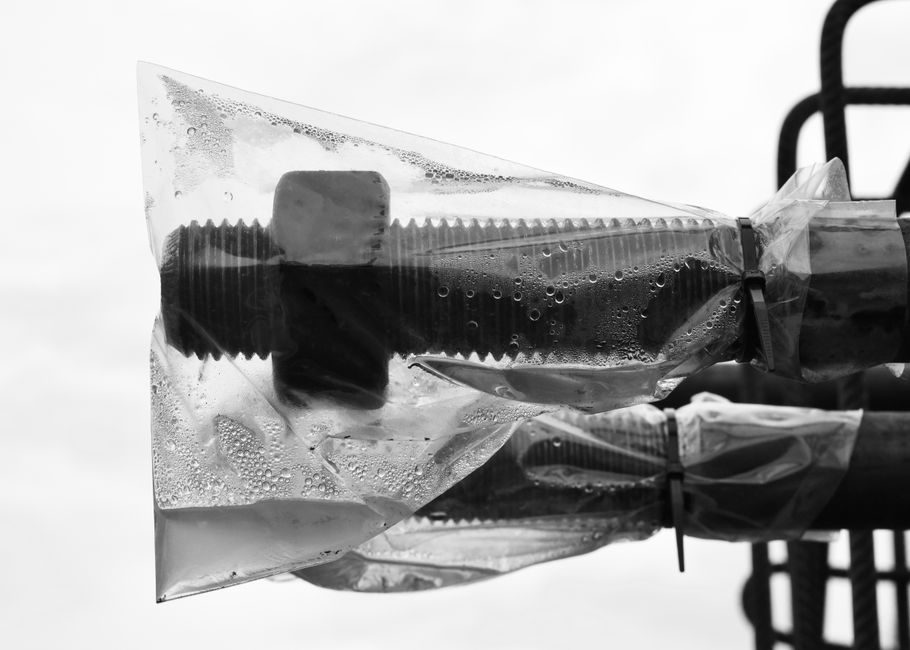
Engineering plastic total cost of ownership resolves into five distinct cost lines: raw resin, conversion processing, installation labor, in-service replacement, and end-of-life disposal, per the TCO framework documented in supply-chain cost management literature [S1]. The cost lines interact multiplicatively, not additively, which is why two materials with similar unit price can produce a 30-50% lifecycle gap over a 10-year window.
This breakdown applies across the major engineering plastic families - engineering plastic grades such as PA66, POM, PC, PBT, and PPS - and to typical service categories like gears, housings, plastic pallet decks, conveyor wear strips, and fluid-handling components. A TCO build is the only credible way to compare engineering plastic against cast iron, aluminum, or stainless steel on equal footing [S5].
Cost Line 1: Resin Selection and Unit Price
Resin grade is the single largest cost-line variable in engineering plastic TCO. General-purpose PA66 at commodity scale sits at the bottom of the engineering plastic price band, while glass-filled PPS, carbon-fiber-reinforced PA66, or bearing-grade POM can run 3-8x higher per kilogram than unfilled PA66. A TCO model that uses the cheapest grade as a baseline systematically underestimates lifecycle spend, because it ignores the wear, fatigue, and chemical-resistance deltas that drive replacement frequency [S1][S5].
Volume tier matters: small-batch orders under 1 tonne typically attract 20-40% surcharges over bulk 10-tonne-plus contracts, and glass-fiber or carbon-fiber reinforced compounds carry minimum-order-quantity constraints that distort apparent unit cost when the actual annual consumption is low. For procurement teams, the right first move is to lock the grade first and then negotiate the volume tier, not the other way around [S1].
Cost Line 2: Processing and Conversion
Processing cost is driven by melt temperature, mold complexity, and cycle time - not just by the resin price tag. PA66 processes at roughly 280-300 degC with a narrow 5-10 degC processing window, which drives higher scrap rates and longer cycle times than the more forgiving POM (190-210 degC) or PP families. Glass-fiber-filled compounds cut cycle time 10-15% relative to neat resin because the fiber stiffens the melt, but they cut tooling life by 30-50% on the same steel because of abrasive wear [S1].
For high-volume plastic pallet and large-format structural components, the dominant conversion cost is mold amortization spread over the production run. A 50,000-shot mold amortized over 1 million parts adds roughly 5-10% to part cost; amortized over 100,000 parts, it can add 50-100%. TCO analyses that ignore this amortization routinely understate the true cost of low-volume engineering plastic parts [S3].
Cost Line 3: Installation and Mechanical Integration
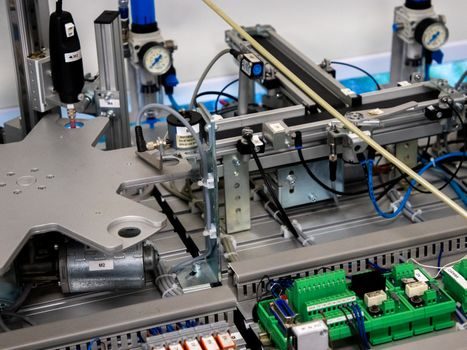
Installation labor is where engineering plastic often beats metal by a factor of 3-5x in real TCO builds. A 2 kg PA66 glass-fiber housing that snaps together with integral clips replaces a multi-bolt aluminum housing; field installation time drops from 12-18 minutes to 2-4 minutes per unit, and the reduced fastener count removes a recurring torque-audit maintenance line [S1].
For fluid-handling service, plastic pipe and steel-plastic-composite-pipe systems push installation savings further: solvent-welded joints run at 2-4 minutes per joint versus 15-25 minutes for flanged steel, and the elimination of flange gaskets removes a scheduled-replacement line that shows up in TCO every 5-7 years. A typical 50-meter process line saves 40-80 labor-hours at install and another 20-40 over a 15-year service window [S3][S5].
Cost Line 4: Service Life and Replacement Frequency
Service life is the TCO line with the widest variance, and the one most often mis-modeled. Engineering plastic parts rarely fail from a single dramatic event; they fail from cumulative creep, UV embrittlement, chemical attack, or fatigue - and these mechanisms have very different time constants. PA66 absorbs 2.5-3% moisture at equilibrium, which shifts both dimensions and tensile properties by 10-20% and roughly halves the continuous-use temperature rating relative to dry-as-molded condition. [S1]
Replacement-frequency modeling should distinguish three regimes: static load (governed by creep), cyclic load (governed by fatigue at 10^6 to 10^7 cycles), and chemical/UV exposure (governed by surface degradation rates). Conflating these into a single "service life" number is the most common TCO error. The honest approach is to model each mechanism separately and take the minimum of the three, then apply a safety factor of 1.5-2.0x to that minimum for the replacement interval [S1][S5].
Cost Line 5: End-of-Life, Recycling, and Disposal

End-of-life cost is small in dollar terms - typically 1-3% of TCO for a clean industrial application - but it is the line that flips fastest under regulatory pressure. The 2026-07 enforcement environment in the EU under extended producer responsibility schemes is pushing per-kilogram disposal surcharges on unfilled engineering plastics from roughly 0.10-0.30 EUR/kg toward 0.40-0.80 EUR/kg over a 10-year horizon, while glass-filled or flame-retardant grades already sit at the upper band because of the contaminated scrap stream [S3].
Regrind strategy matters: clean, single-stream PA66 regrind can substitute for 15-25% of virgin material with only a 5-10% mechanical-property penalty, which effectively writes down the resin cost line by a similar percentage. Contaminated or glass-filled regrind, by contrast, typically lands in landfill or waste-to-energy at a net cost of 0.50-1.20 EUR/kg. The disposal-cost differential alone can swing 10-year TCO by 5-8% for high-tonnage applications like pallets, crates, and wear strips [S3].
Comparison: PA66 vs POM vs PC for a 10-Year Mechanical Service Window
For a generic 0.5 kg gear or wear-block in a continuous-duty mechanical service application over a 10-year window, three engineering plastic candidates line up as follows against four TCO decision criteria: PA66 (glass-filled) wins on raw mechanical strength and temperature ceiling but loses on moisture sensitivity; POM (acetal homopolymer) wins on dimensional stability, low friction, and ease of machining, but loses on continuous-use temperature above ~100 degC and on chemical resistance to strong acids; PC (polycarbonate) wins on impact resistance and transparency, but loses on chemical resistance to common solvents and on long-term UV performance unless a stabilized grade is specified [S1].
On replacement frequency, the ranking in a moderate-temperature, dry, low-UV environment is POM > PA66 > PC, but the ranking flips in a wet or hot environment to PA66 (glass-filled) > POM > PC. The TCO recommendation therefore depends entirely on the dominant failure mechanism, which is why no single engineering plastic wins every application [S1][S5].
Who TCO Analysis Is For - and Who It Is Not For

A formal TCO build pays off when the part is high-tonnage, the service window is longer than 5 years, and the part is part of a maintenance contract where replacement labor is charged at fully loaded industrial rates. It also pays off when the engineer is comparing engineering plastic against metal alternatives, because the hidden savings (no painting, no plating, no torque-audit, no corrosion allowance) are precisely the lines that get dropped in a unit-price-only comparison [S1][S3].
TCO is overkill for low-tonnage prototype parts, for one-off replacement orders below 100 pieces, and for components with a service life of less than 2 years - the discount-rate and end-of-life modeling overhead exceeds the actual cost-line resolution. It is also unreliable when the underlying wear or fatigue data is missing for the specific grade; an honest TCO model should refuse to produce a number in that case and instead flag the missing-data gap, rather than fabricate a service-life figure [S5].
Limits and Failure Modes of the Five-Line TCO Model
The five-line structure breaks down when a sixth cost line dominates - usually certification, regulatory compliance, or fire/smoke performance. UL94 V-0 grades of engineering plastic carry a price premium of 30-80% over the same base resin in a non-flame-retardant grade, and NSF61 or food-contact certified grades sit 15-30% above commodity. For pressure transmitter housings and similar safety-relevant enclosures, the certification line can exceed the raw resin line in dollar terms and must be modeled separately [S3].
The second failure mode is discount-rate mis-selection. Engineering plastic TCO is sensitive to the discount rate because most of the spend is front-loaded in resin and conversion, while savings are back-loaded in installation and maintenance. A 3% versus an 8% discount rate can swing the present-value comparison between engineering plastic and stainless steel by 15-25%. The defensible practice is to publish the TCO at two rates - typically 3% (public-sector / municipal) and 8% (private-sector industrial) - and let the procurement team pick the one that matches their hurdle [S6].
Standards and Sourcing Discipline
Engineering plastic TCO should anchor to ISO 1043-1 for resin marking and ISO 11469 for generic identification, and the underlying mechanical and thermal properties should be drawn from the manufacturer's datasheet at the conditioned (50% RH equilibrium for PA66) state, not the dry-as-molded state. For load-bearing service, ISO 899-1 (tensile creep) and ISO 899-2 (flexural creep) provide the long-term modulus data that drives the replacement-frequency line. None of these standards are optional - the typical TCO error of 2-3x on a 10-year window traces back to datasheet values that were either misread or applied outside their conditioning envelope [S1][S5].
Two trackable signals to watch for 2026-07 procurement cycles: extended producer responsibility fee schedules in the EU, which move the disposal cost line most aggressively; and feedstock volatility for PA66 and POM, which moves the resin cost line 10-25% quarter-to-quarter. Both are variables the TCO model should be re-run against at every quote refresh, not locked at the start of the procurement cycle. See how a similar five-line breakdown is built for related industrial assets in Shuttle System TCO: Five Cost Lines That Decide a 10-15 Year Spend and in Aluminum Die Casting Machine TCO: Five Cost Lines That Decide 5-7 Year Spend.