
Global metal magnesium consumption sits at 1.21 million tons in 2025 and is projected to climb to 1.63 million tons by 2031, a 5.08% CAGR driven primarily by automotive lightweighting, aerospace re-entry, and aluminum-alloy demand, per Mordor Intelligence's January 2026 release [S3].
The primary magnesium ingot segment is valued at $5.6 billion in 2025 and is forecast to reach $7.71 billion by 2031 at a 5.47% CAGR, with purity grades (3N and 4N) commanding premium pricing as electronics and aerospace buyers tighten specs [S2].
Volume baseline: how big is the 2026 magnesium ingot market?
Two independently published 2026 figures define the volume envelope. Mordor Intelligence reports 1.27 million tons of metal magnesium consumption in 2026, up from 1.21 million tons in 2025, with the magnesium die casting machine supply chain absorbing a meaningful share of the 1.27 Mt total because high-pressure die casting (HPDC) is the dominant forming route for structural automotive parts [S3].
Pro Market Reports and Data Insights Market converge on $5.6 billion for 2025 primary magnesium ingot value, rising to $5.91 billion in 2026 and $7.71 billion by 2031, indicating tight alignment between the volume and value tracks across publishers [S2][S4]. The Data Insights Reports metal-magnesium total (ingot, powder, granules) tracks a parallel 5.019 B (2026) to 8.01 B (2034) envelope at 6.1% CAGR, with the ingot form flagged as the dominant segment [S1].
Demand drivers: which applications pull tonnage through 2026-2030
Automotive lightweighting is the single largest tonnage sink, where every 100 kg removed from a passenger car yields roughly 0.4 L/100 km fuel-economy gain in ICE powertrains and a measurable range uplift in battery EVs, the economic threshold that has moved Mg structural castings from show-piece parts to series production [S1].
Aerospace is a smaller volume, higher-margin lane: Mg usage is concentrated in non-critical structural components and interior brackets where the 1.74 g/cm³ density (versus 2.70 g/cm³ for Al and 7.87 g/cm³ for steel) cuts mass without re-qualifying the primary load path [S1]. Electronics is the third pillar, with 3N (99.9%) and 4N (99.99%) purity grades feeding aluminum alloy modification and sacrificial-anode production, both of which require consistent Fe/Ni/Cu control below 50 ppm for battery-grade Al-Mg alloys [S2].
Supply concentration: who actually makes the tonnage
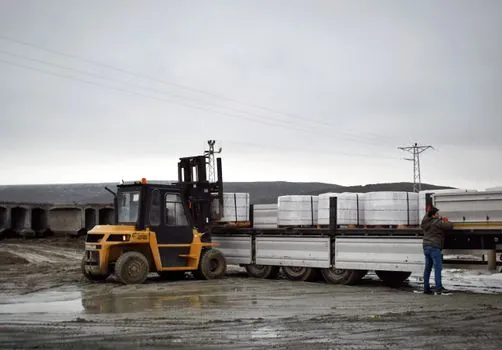
China holds an estimated annual primary magnesium production exceeding 7 million metric tons of ore-equivalent capacity, dominating both raw material and refined ingot output, with Russia and the United States as the next-tier producers [S4].
Purity grades and price stratification
The purity ladder divides the market into three bands: less than 99.9%, 99.9%-99.999% (3N-5N), and more than 99.999% (6N), with 99.9%-99.999% grades accounting for the largest commercial volume and 6N reserved for semiconductor and high-end aerospace brackets [S4].
5N and 6N ingots command measurable premiums over 3N stock because electrolytic refining energy intensity scales non-linearly with purity; the same 1,200 kWh/ton figure cited for Pidgeon-process 3N roughly doubles to 2,400-2,800 kWh/ton for 5N electrolytic output, the cost floor that keeps the high-purity segment in tight supply [S6].
Constraint layer: energy cost, regulation, and flammability

Three structural headwinds bracket the 2026-2030 forecast.
Third, inherent Mg flammability: solid ingots ignite above 473°C in air and chips/dust ignite at 250°C, a handling constraint that drives Type D fire-suppression specs at every converter and stamping cell downstream [S2].
Comparison: Pidgeon vs electrolytic vs recycled feedstock
Decision criteria for buyers sourcing ingot between 2026 and 2030 line up against three production routes. Pidgeon (silicothermic): lowest capex, China-dominant, 1,200 kWh/ton energy, 2.0-2.5 kg CO2/kg Mg, 3N ceiling without secondary refining [S2].
Electrolytic (molten-salt): higher capex, Norway/Canada/Israel footprint, 2,400-2,800 kWh/ton, 1.0-1.3 kg CO2/kg Mg on hydro-powered grids, reaches 5N-6N directly [S6]. Recycled feedstock: lowest energy intensity (~5% of primary), limited to 3N output because tramp elements accumulate through re-melt cycles, best fit for industrial valve bodies and non-safety automotive castings where purity is negotiable [S2][S4].
Standards and specification gates buyers should anchor on
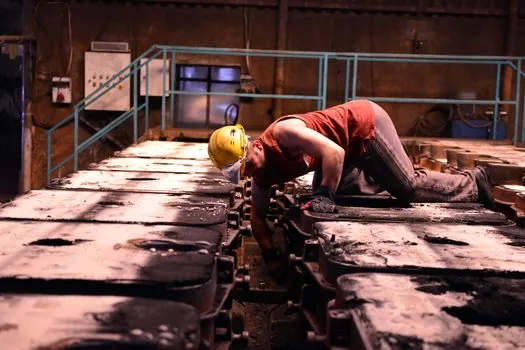
Three specification families govern the buy side. ASTM B93 / B94 covers Mg and Mg-alloy ingot and cast-product chemistry, with grade AZ91D (Al 9.0%, Zn 0.7%, Mn 0.2%) the volume benchmark for HPDC automotive structural parts. ISO 3116 defines wrought Mg alloy compositions referenced by aerospace Tier-1s. [S2]
For purity verification, buyers should request a mill cert with Fe/Ni/Cu each below 50 ppm for battery-Al alloy applications and below 10 ppm each for 5N electronics use, with O2 and H2 measured by LECO on a per-heat basis rather than per-lot averages to avoid the bracket-to-bracket variation that drives pressure sensor drift in downstream heat-treat furnaces [S2][S6].
What the 2026-2030 forecast actually means for procurement
Plan for a 5.0-5.5% CAGR in primary Mg ingot value and a 5.08% CAGR in volume through 2031, with the China concentration risk persisting because no project outside China has reached the 50,000 t/y threshold in published engineering studies [S1][S2][S3].
Two trackable signals to watch into 2027: Norwegian and Canadian electrolytic capacity ramp announcements (Wenatchee, Becancour, and Sunndal expansions), and any change in Shanxi provincial Pidgeon-emission enforcement, either of which would re-rate the 1.63 Mt 2031 baseline by plus or minus 8-12% within 12 months [S3][S4].
For related coverage, see Sludge pump TCO breakdown: 2026 spec gates, energy share, and ownership vs rental math.