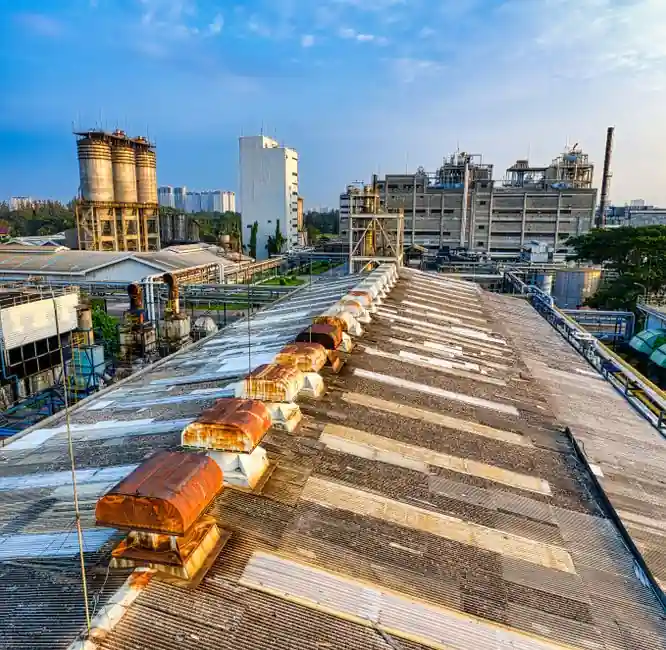
Capital cost for a polyurethane elastomer production line in 2026 is dominated by reactors, foaming and casting equipment, pollution control hardware, and the working capital tied to MDI/TDI feedstock exposure, with project reports modelling plants in the 50,000-200,000 t/yr band [S1][S4].
Elastomer plants sit in a distinct sub-segment of the broader polyurethane market, valued at USD 5.15 Billion in 2026 and projected to USD 7.08 Billion by 2035 [S6]. Capex per ton is materially higher than for commodity flexible foam because elastomer lines need precision metering, hot-cast or reaction-injection moulding stations, and longer cure tunnels, on top of the standard isocyanate safety envelope.
Capex line items that move the budget
Capital requirements for a polyurethane plant span land acquisition, civil construction, equipment procurement, installation, pre-operative expenses, and initial working capital, with each bucket scaled to the chosen capacity [S1]. Within equipment, the cost-heavy items are multipurpose reactors, foaming machines, casting lines, storage and handling for isocyanates, and pollution control devices required to meet emissions rules on VOCs and amine carryover [S4].
For elastomer grades, the equipment list is heavier on metering machines (typically low-pressure or high-pressure RIM/CPU dosing units), mould carriers, and post-cure ovens, plus analytical labs for NCO titration and hardness testing. The required storage infrastructure for MDI and TDI includes nitrogen blanketing, temperature-controlled tanks, and dedicated unloading bays, all of which push the mechanical line of the capex table above what a foam-only plant would carry [S5].
How capacity tier shifts the per-ton capex
Reference plants modelled at 50,000-200,000 t/yr annual capacity enable economies of scale while keeping operational flexibility, and the same modular logic applies to elastomer sub-lines embedded inside a general-purpose PU facility [S1]. Below roughly 20,000 t/yr, elastomer-specific units struggle to absorb the metering and cure-oven capital, which is why most merchant elastomer capacity is built in 30,000+ t/yr blocks or as a downstream line inside a larger polyol/isocyanate hub.
The elastomer sub-market is growing faster than the parent polyurethane market, with 2026 elastomer demand at USD 5.15 Billion against a broader PU market of USD 88.3 Billion in 2025, signalling that elastomer capex projects face less pricing pressure than commodity slabstock foam but more raw-material volatility because MDI and TDI alone represent 60-70% of total production expenses across the PU chain [S6][S3].
Raw materials and feedstock exposure
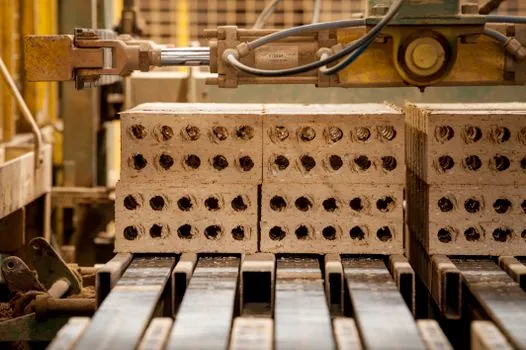
MDI and TDI together account for 60-70% of total production expenses in polyurethane, and their prices move with crude and natural-gas feedstocks, which means working capital is the capex line item most often underestimated by first-time builders [S3]. Polyol is the second swing factor, and the push toward bio-based polyols from renewable sources changes both the OpEx mix and the storage/handling capex because bio-polyols often need heated storage and nitrogen inerting to control moisture and oxidation.
Isocyanate procurement contracts typically include take-or-pay clauses and quarterly price re-openers, so lenders and EPCs sizing initial working capital usually reserve 3-6 months of MDI/TDI cover as part of the capex envelope, separate from the physical plant cost [S3]. For elastomer plants, the additional chain extender (1,4-BDO or DETDA) and any internal mould-release or pigment dosing adds a smaller but real inventory line.
Environmental compliance as a hard cost driver
Environmental regulations have emerged as a critical cost driver in polyurethane production, fundamentally reshaping the economics of new builds and requiring dedicated capex for emission control, wastewater treatment, and increasingly carbon-capture-ready process design [S3]. For an elastomer plant, the specific compliance hardware covers amine scrubbers on casting station vents, thermal oxidisers for fugitive TDI, and segregated wastewater streams for the demould and post-cure areas.
Older foam plants running on HCFC or high-GWP blowing agents are being retrofitted, and any new elastomer line in 2026 will be specified low-GWP from the outset, which typically means HFOs, hydrocarbons, or water-blown systems depending on the density target. Closed-loop manufacturing and chemical-recycling workstreams are moving from pilot to bankable scope, and EPCs now price them in as optional capex blocks rather than afterthought retrofits [S3].
Operating cost versus capex split
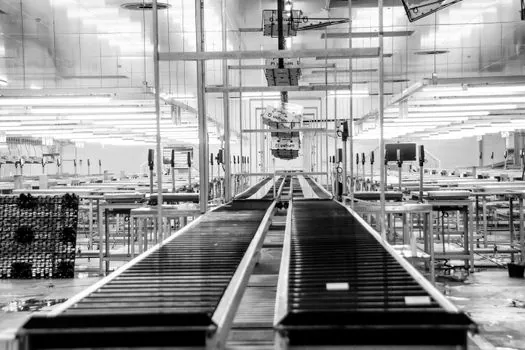
Gross profit margins for polyurethane plants modelled in 2026 reports sit in the 20-30% range, with net margins of 10-15%, which means the project must clear both a payback hurdle and a feedstock-cycle stress test before the capex stack is approved [S1]. Once commissioned, elastomer lines carry higher per-ton conversion costs than foam lines because of the metering precision, longer cure cycles, and lower throughput per square metre of floor space.
Total cost of ownership comparisons show that a cast polyurethane elastomer component typically costs two to four times more per unit than its rubber equivalent, so elastomer plants must monetise a performance premium, longer service life, or a downstream specification (oil and gas, mining, wheels, seals) to justify the higher capex per ton of finished part [S8]. The trade-off is articulated in the polyurethane elastomer fundamentals reference page, and it feeds straight back into the chosen production route.
Decision map: who this build is for, and who it is not
An elastomer-focused polyurethane plant suits an existing polyol or isocyanate producer adding downstream value, or a specialty chemicals player targeting oil-and-gas, mining, automotive suspension, and industrial wheel applications where the 2-4x unit-cost premium over rubber is recoverable through service life [S8]. It is not a fit for a first-time chemical investor without secured offtake, because the isocyanate logistics and compliance capex alone can absorb 18-24 months of build time before any revenue line is booked.
Comparison against the main production routes on four decision criteria: (1) capital intensity, RIM/CPU cast elastomer lines are higher than slabstock foam but lower than fully integrated MDI production; (2) feedstock risk, all routes share MDI/TDI exposure but elastomer lines carry a smaller polyol swing; (3) compliance load, cast elastomer is moderate, slurry-handling and TPU extrusion carry higher amine and solvent control cost; (4) time to revenue, 18-30 months for an elastomer sub-line versus 36-48 months for a greenfield integrated PU complex. Procurement and EPC inputs from [S4] line up with these brackets.
Standards, sourcing, and what to verify in a 2026 DPR
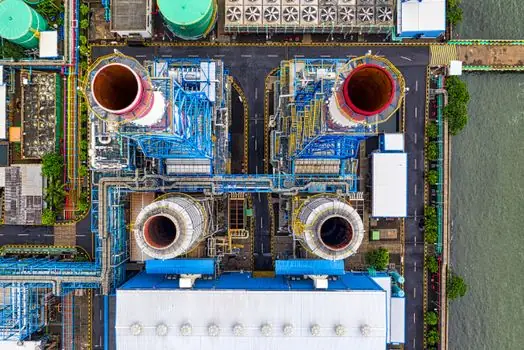
A 2026 detailed project report should be benchmarked against the four canonical cost layers: fixed cost, conversion cost, variable cost, and project economics with ROI and NPV, all of which appear in the Procurement Resource report scope and align with the IMARC DPR structure [S1][S4]. On the equipment side, buyers should confirm reactor pressure ratings, isocyanate-compatible seal materials, and ATEX/IECEx zone classification for the casting and cure halls, without pinning those requirements to a specific revision date that the research does not confirm.
For elastomer plants, two extra sourcing signals are worth tracking: (a) regional catalyst supply for the tin/amine systems used in CPU and TPU, which has its own award cycle covered in a recent refinery and chemical-plant catalyst supply note; and (b) any change in chain-extender offtake, since 1,4-BDO pricing has been as volatile as MDI over the past two reporting cycles. Together with the polyurethane insulation context for downstream pull, these are the next nodes a 2026 project reviewer should track before signing the EPC lump-sum.
Component reference pages worth checking: concrete batching plant.