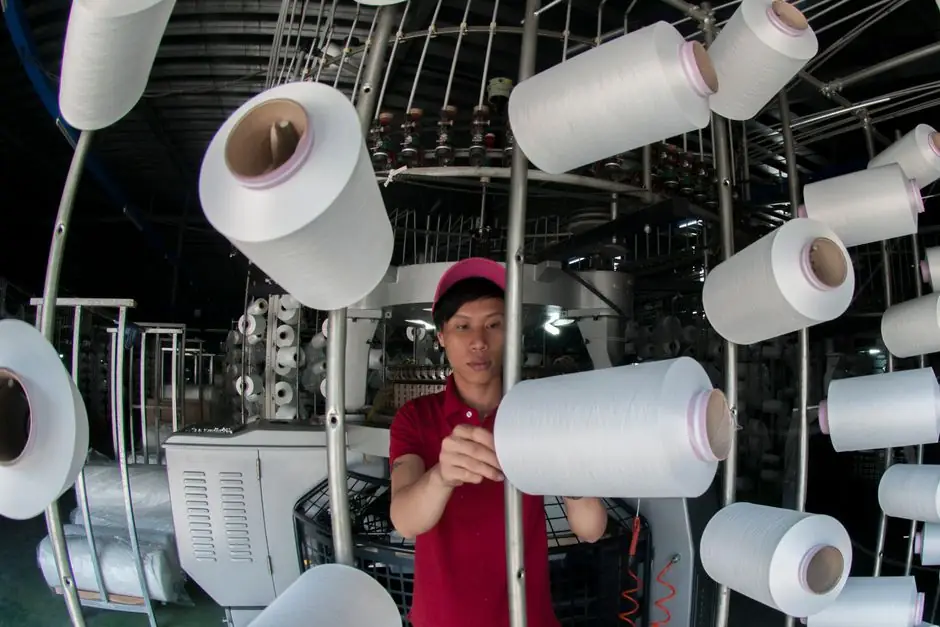
Global PVC resin demand reached an estimated $79 billion in 2026, with the top five producers (INEOS, Westlake, Braskem, Shin-Etsu Chemical, and LG Chem) jointly holding 32.6% of the market in 2025, while broader top-ten groupings are reported to control around 46% of supply [S1][S6].
No single PVC manufacturer runs the industry. INEOS led the field at just over 8.5% share in 2025 [S1], and the remaining capacity is spread across integrated chlor-alkali operators, regional champions, and specialty compounders, which keeps PVC procurement more fragmented than the polyester or polyethylene supply chains.
Top-Five and Top-Ten Manufacturer Share in 2025–2026
Market share concentration in PVC is materially lower than in most polyolefin chains. INEOS held over 8.5% in 2025, with Westlake, Braskem, Shin-Etsu Chemical, and LG Chem rounding out the top five; the group combined for 32.6% of global supply [S1]. The next tier includes Formosa Plastics, Orbia, Solvay, SCG Chemicals, and historically Axiall, lifting the broader top-ten cluster to about 46% of world output [S6][S5].
The supply map cited by Strategic Market Research explicitly names Shin-Etsu, Westlake, Formosa Plastics, INEOS, and Orbia as leading players in the same list, confirming overlap rather than a single coherent leaderboard [S5].
Regional Share: Asia-Pacific, North America, and the Resin Macro Frame
Asia-Pacific dominated the broader resin market with a 44.00% share in 2025 and is also flagged as the largest PVC resin region in the GMI segmentation [S1][S4]. Within PVC specifically, North America is reported as the largest market in the Market Research Future segmentation (around 40% of global PVC resin demand), driven by building and construction, while Asia-Pacific is called out as the fastest-growing region on the back of automotive and packaging pull [S3].
The differing region leaders across reports are not contradictions, they reflect the boundary drawn in each study: a resin macro study buckets polyethylene, polypropylene, PVC, and others together, which inflates Asia-Pacific because of Chinese polyolefin scale [S4]. PVC-only studies tend to show North America and Asia-Pacific trading the top slot depending on whether construction or automotive tonnage is weighted more heavily [S3]. Buyers should treat the two narratives as compatible rather than competing.
Product Mix Driving the Share Numbers: Rigid, Flexible, CPVC, and Process Route
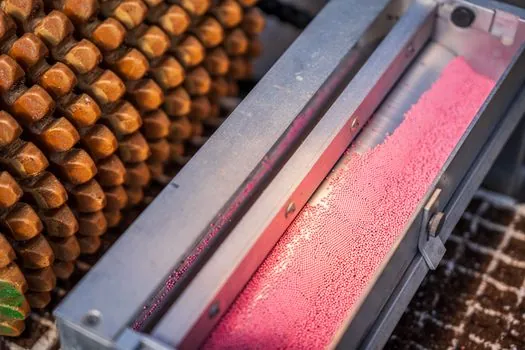
Rigid PVC held about 46.7% of the broader PVC market in 2024, with construction applications the dominant volume sink [S9]. The ethylene-based production process accounts for roughly 65% of PVC resin output, with the acetylene/calcium-carbide route making up most of the remainder, and this split is largely why Asian integrated players (coal-to-VCM in China) and Western ethylene crackers (INEOS, Westlake, Formosa) end up in the same top-ten list despite very different feedstock economics [S6].
Suspension grade is the volume workhorse, emulsion and bulk grades take specialty and medical share, and chlorinated PVC (CPVC) is described as a margin leader in hot-water and industrial piping even though it is not a volume leader [S5]. That margin-versus-volume split is why suppliers with strong specialty and medical-grade capability (Shin-Etsu, Westlake) tend to sit higher in revenue share than their suspension-grade nameplate capacity alone would suggest.
End-Use Tonnage Behind the Supplier Map
Building and construction was the largest end-use in 2025 at $33.00 billion of PVC resin demand, followed by electrical and electronics at $13.05 billion and automotive at $12.72 billion [S1]. Medical and pharmaceuticals, at $5.20 billion, is the fastest-growing end-use and is pulling the supply mix toward compliant specialty grades with full additive traceability [S1][S5].
For pipe-grade suspension resin, the same producers compete on caustic-soda co-product economics, not just polymer price. To put PVC pipe applications in context of the broader plastic-pipe specification universe, see the entry on PVC-U pipe.
How Buyer Segments Should Read the Share Map

A large-volume pipe converter that buys on $/ton can reasonably dual-source between two or more top-five PVC producers and a regional integrated player, because no single supplier controls the chain. A medical or wire-and-cable compounder buying DEHP-free, low-leachables, fully documented flexible PVC faces a much narrower pool: effectively Shin-Etsu, Westlake, and a small number of qualified specialty compounders, which is why compliance premiums persist in those grades [S1][S5].
Construction buyers dealing with rigid profiles and pressure pipe should weight regional logistics, lead time, and grade consistency over headline market share, because top-five share figures mask the reality that the fifth- and sixth-largest suppliers in any given region often hold more share within that region than the global numbers suggest. The broader synthetic resin category, which includes polyethylene, polypropylene, and PVC, shows a similar pattern of moderate concentration with a clear tier of regional champions. For buyers cross-referencing with adjacent engineering polymers, the contrast in supplier concentration is informative: POM and PEEK markets are considerably more concentrated at the top end than commodity PVC.
Data Caveats and What the 2026 Numbers Do Not Tell You
The top-five share figure of 32.6% comes from a single 2025 GMI estimate and should be treated as one analyst's read rather than settled fact, since Strategic Market Research, Market Research Future, and Business Research Insights each report slightly different leadership lists [S1][S3][S5][S6]. Forecast horizons also diverge: GMI projects a 4.2% CAGR through 2035 to $114.7 billion, Precision Business Insights projects 3.9% to $62.9 million by 2032 (note the unit discrepancy in the source), and Strategic Market Research projects 5.9% to $88.5 billion by 2030 [S1][S2][S5].
Trade actions are another wildcard: India's pending domestic capacity additions and active anti-dumping measures on imported suspension PVC will redistribute share between Asian and Middle Eastern suppliers through 2026–2027, and European regulatory tightening on stabilisers and plasticisers is quietly favouring producers with established non-lead, non-phthalate portfolios [S1][S5]. A second variable worth tracking is how quickly Chinese integrated coal-to-VCM producers expand export share into Africa and Southeast Asia, which is the most likely structural shift in the supplier map over the next 24 months. The broader competitive dynamic in adjacent polymer chains, covered in Epoxy Resin Demand 2026-2030, offers a useful comparison for how feedstock integration reshapes supplier rank.