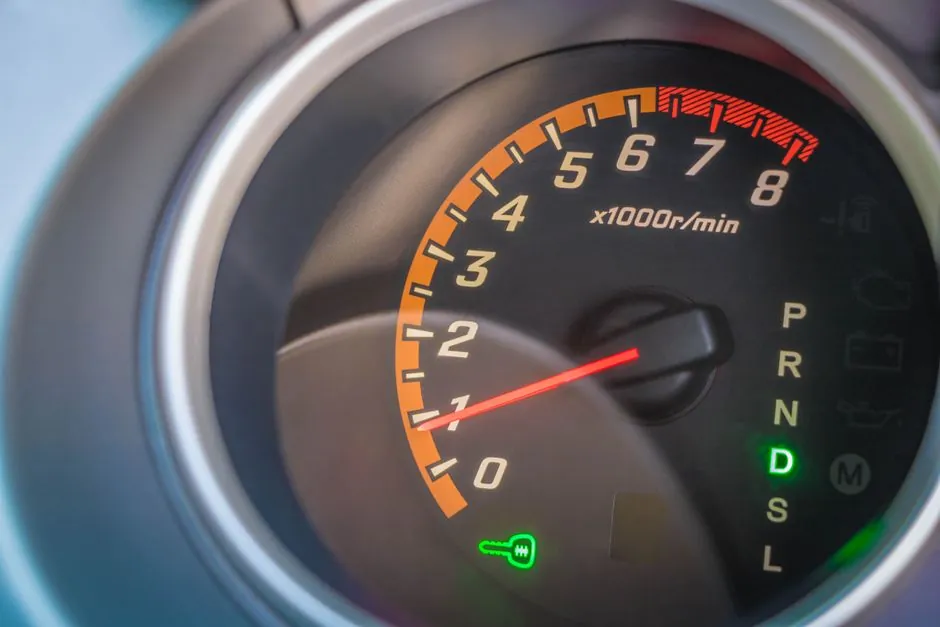
A 1× tracking filter is a narrow band-pass that follows the once-per-revolution (1× RPM) frequency in real time, accepting only vibration energy within a small window around the current shaft rate and rejecting all out-of-band noise [S3]. On a handheld or portable vibration meter wired to a tachometer, the analyzer uses the tachometer pulse train to compute instantaneous angular velocity, then re-tunes its filter center frequency on every block so the band stays glued to 1× even during acceleration or deceleration [S1][S6].
The output is a single time-history or amplitude-versus-RPM trace of the 1× vibration level, typically expressed in mm/s RMS, g, or g-peak depending on the meter's setup, and a typical tacho input spec on a portable data collector is 5 to 200,000 RPM with ±0.01% of reading accuracy [S2]. That narrow-band output is the cleanest possible view of running-speed vibration, which is why the 1× reading is the first number a condition-monitoring engineer writes down on a route sheet.
What "1x" actually means on the analyzer
The "1×" notation is shorthand for order 1, meaning the vibration component whose frequency equals the shaft's rotation frequency: f1× = RPM / 60 Hz [S3]. A 1,500 RPM motor running at 25 Hz has its 1× component at 25 Hz, 2× at 50 Hz, 3× at 75 Hz, and so on, with each integer multiple called an order [S1]. On a standard FFT spectrogram the 1× line is the lowest horizontal line in a family of parallel order lines, and it is the line that always tracks the tachometer trace on a Waterfall or Campbell plot [S3][S5].
Because real machines rarely hold a perfectly steady speed, a fixed-band FFT bin centered on 25 Hz will miss the 1× component as the shaft drifts to 1,480 or 1,520 RPM, smearing the energy across several FFT bins and under-reading the true amplitude [S1]. A tracking filter solves this by moving its pass-band with the shaft, so the same 1× energy is captured regardless of small speed excursions during the measurement window [S3][S5].
Tracking filter vs fixed-band FFT: when each one wins
For steady-state machinery on a fixed utility supply, a stationary FFT centered close to the 1× frequency gives equivalent amplitude to a 1× tracking filter, with the advantage of also showing 2×, 3×, sidebands, and broadband noise in the same acquisition [S1]. For variable-frequency drives, run-up/coast-down ramps, diesel engines, and any process where RPM changes by more than roughly 1 to 2% during the sample, the tracking filter is the only reliable way to read 1× [S3][S8]. Brüel & Kjær's 1995 order-tracking review formalized this trade-off and introduced digital resampling order tracking as the dominant implementation in modern FFT analyzers [S5].
Typical selection criteria line up as follows. (1) Speed stability: choose fixed FFT if RPM is steady within ±1%; choose tracking filter or order tracking if RPM sweeps. (2) Fault type of interest: a 1× tracking filter is best for unbalance, shaft bow, and eccentricity; broadband FFT is required for bearing, gear-mesh, and broadband-cavitation diagnostics. (3) Number of orders: if you need all orders simultaneously, resampling order tracking beats a single tracking filter because it produces a full order map from one acquisition [S5][S6]. (4) Instrument class: a basic tachometer plus a two-channel FFT analyzer is the minimum hardware, while a dedicated vibration analyzer adds live order maps, phase, and orbit display.
How the analyzer actually computes the 1x reading

Modern order-tracking analyzers do not literally slide an analog band-pass; they oversample the vibration signal, compute angular position from the tachometer pulse train, then resample the time-domain waveform at fixed angular increments so the resampled data has a constant samples-per-revolution (SPR) rate [S5]. An FFT on that resampled data produces an order spectrum with sharp order lines regardless of speed variation, and a 1× tracking filter becomes a single-bin readout at order 1 plus a small guard band of typically ±0.5 to ±2 orders depending on the instrument [S1][S5].
The tachometer signal itself is usually a once-per-revolution pulse from an optical, magnetic, or Hall-effect sensor pointed at a key, gear tooth, or reflective mark, and a representative specification is 5 to 200,000 RPM with ±0.01% of reading accuracy on a portable data collector using a Monarch Instrument PLT200 [S2]. Higher-end analyzers can also extract a pseudo-tachometer from the VFD carrier ripple in the vibration signal when no physical tachometer is installed, which is useful on retrofit VFD-driven pumps and fans where tapping a tacho pulse is impractical [S8].
Who should use a 1x tracking filter, and who should not
Use a 1× tracking filter on route-based condition monitoring of induction motors, pumps, fans, and gearboxes when the primary question is "is the unbalance or misalignment getting worse?" A single 1× RMS reading in mm/s, compared against ISO 10816-3 zone boundaries for the machine class, catches the majority of balance-related defects in under a second per measurement point [S7]. The same reading also feeds trending systems that alarm on percentage week-over-week change in 1× amplitude.
Do not use a bare 1× tracking filter as a stand-alone diagnostic tool for rolling-element bearings, gear-mesh faults, or broadband cavitation: those defects live at non-1× frequencies, and a 1× filter will actively reject them [S1][S3]. For those fault classes, run a full FFT spectrogram or a higher-order tracking filter centered on the bearing race frequencies (BPFO, BPFI, FTF, BSF) or on the gear-mesh frequency, and use the 1× filter only as a reference channel. Also, on machines with severe torsional vibration or load-induced angular acceleration, the tachometer signal may not faithfully represent instantaneous shaft speed, and a vibration sensor mounted to measure torsional twist directly is a better phase reference.
Reading the 1x number in practice
With the filter locked and the tachometer trusted, the 1× reading is typically reported in mm/s RMS (the ISO 10816-3 unit) for overall severity, or in g-peak when the goal is to compare against a balance-grade target such as G2.5 or G6.3 for the rotor [S1][S3]. Phase, measured as the angle between the tachometer pulse and the peak of the filtered 1× waveform, is what turns a 1× amplitude reading into an unbalance correction: a consistent phase drift over weeks is one of the cleanest indicators of buildup on a fan impeller or a coupling alignment shift [S1].
A 1× tracking filter is also the cleanest way to measure critical speed during a run-up: as RPM crosses a structural resonance, the filtered 1× amplitude peaks sharply because the rotor's 1× excitation aligns with a natural frequency, and the peak RPM is the critical speed [S5]. Modern order-tracking analyzers automate this by sweeping RPM, plotting 1× amplitude versus RPM, and flagging the peak with a marker, which is faster and more repeatable than picking peaks out of a Waterfall spectrogram by eye [S5][S6].
Failure modes and operator pitfalls
Three failure modes account for most bad 1× readings in the field. (1) Tachometer trigger set on the wrong edge or wrong number of pulses per revolution, which silently halves or doubles the apparent RPM and pushes the tracking filter off the real 1× frequency by an octave [S1][S2]. (2) Loose mounting of the accelerometer, which adds a low-frequency resonance to the channel and inflates 1× amplitude artificially; this is the classic "high 1× that disappears when you re-mount the stud" reading. (3) Aliasing on variable-speed runs when the sample rate is not tied to the tachometer, so FFT bins smear across the 1× line; the fix is resampling order tracking or a tracking-filter acquisition that locks samples per revolution [S5][S8].
Operators should also confirm the tachometer is producing one clean pulse per revolution, not a burst of pulses from a gear tooth or a multi-vane target, and that the pulse-train polarity matches the analyzer's expectation; a 1× reading that is exactly half of expected is the most common symptom of a missed tooth on the reference target [S2]. For permanent vibration condition monitoring installations, redundant tacho channels and a verified pulse-per-revolution count are non-negotiable, because every downstream order reading is a direct function of that pulse train.
Trackable signals for the next 6 to 12 months: wider adoption of pseudo-tachometer extraction from VFD-driven vibration signals in retrofit condition-monitoring nodes [S8], and continued displacement of single-order tracking filters by full order-map acquisition on portable analyzers in the sub-$15,000 class, driven by falling DSP cost and customer demand for a single acquisition to cover 1×, gear-mesh, and bearing frequencies [S5].
Background reading: 10 Inch vs 12 Inch Optical Comparator: Screen, Stage, Part Capacity.