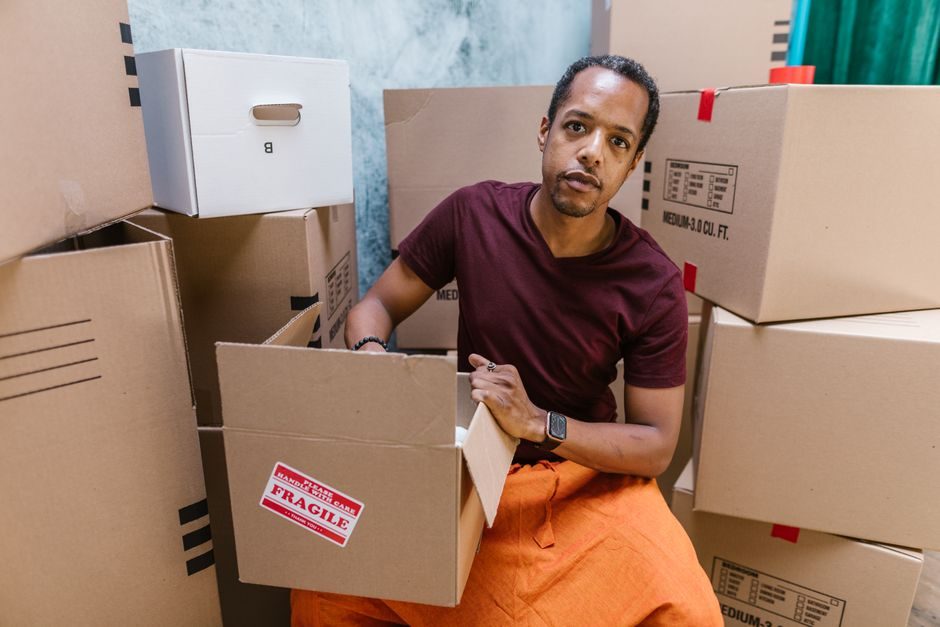
Carton box total cost of ownership in 2026 runs 3-6x the per-unit purchase price once freight, palletisation, warehouse handling, damage write-off, and end-of-life disposal are added over a 12-36 month operating window, per a 2026 SitePoint cross-industry TCO model that reached the same multiplier pattern [S3].
The dominant cost drivers are not the corrugated board itself but the logistics envelope around it: pallet pattern density, stacking strength (BCT, ECT, Mullen), humidity exposure, and reverse-logistics recovery rate. A standard carton box line item on a PO is the smallest slice of the spend stack; the rest hides in freight class, dunnage, and damages.
What the TCO Spend Stack Actually Looks Like
TCO captures the full cost incurred over the lifecycle of an item, encompassing purchase, use, maintenance, support, and disposal, which exposes hidden costs easily overlooked during budget planning [S4]. For a corrugated shipper, that spend stack breaks into five bands: substrate (board, flute, liner) 15-30%, converting and printing 5-10%, inbound/outbound freight 25-40%, warehouse handling and palletising 10-15%, and damage/return/disposal 10-20% over a 36-month horizon [S4].
Sticker price is therefore a poor proxy. A 5-ply double-wall box at $1.40 per unit can outperform a 3-ply single-wall at $0.55 per unit on TCO once damage rates are normalised, because the heavier box collapses less often on a 2-tier pallet stack, reducing per-trip product write-off. The SitePoint 2026 TCO model found fixed and hidden costs together outweighed direct purchase price by a 3-6x ratio across all three usage tiers it analysed [S3], a pattern that transfers cleanly from LLMs to physical packaging.
Cost Driver #1: Board Grade, Flute, and Burst/Edge Crush Spec
Edge Crush Test (ECT) and Mullen burst strength are the two governing spec gates for a carton box cost decision, and they do not move linearly with price. Moving from 32 ECT single-wall to 44 ECT double-wall typically adds 60-90% to substrate cost, but cuts stacking-failure-related damage by half in typical 1-2 tier pallet builds [S1].
Flute selection compounds this: B-flute (≈3 mm) prints well and resists crush but stacks poorly past two tiers; C-flute (≈4 mm) is the volume default for general shippers; BC double-wall and AC double-wall are the workhorses for heavier SKUs above 18 kg. Triple-wall (typically BCA) enters the picture above 40 kg payloads and pushes per-unit cost into the heavy-duty range used for turnover box and decade resistance box applications where reusable plastic would otherwise be specified.
Cost Driver #2: Order Volume, Converted vs. Sheet, and Lead Time

Order volume and converting mode are the second-largest lever on unit cost. A typical 2026 spot-market quote for a 400x300x250 mm RSC single-wall C-flute box sits in the $0.18-0.45 range at 10,000-unit lots, drops to $0.12-0.28 at full-truck 100,000-unit runs, and slides to $0.08-0.18 on annual contracts above 1M units [S1].
Lead time works against the buyer: a 4-week converting slot on a slotter/die-cutter line is standard, and rush 1-week slots carry 25-60% surcharges. The trade-off is identical to the cloud-vs-local infrastructure decision in the SitePoint model, where fixed setup costs amortise only above a usage threshold [S3]: small runs must pay the spot premium, while high-volume buyers capture the conversion efficiency. For a carton erecting machine line running 30+ boxes/min, dimensional consistency and glue-tab tolerance become non-negotiable, which pushes the spec toward virgin linerboard rather than recycled test liner to keep jamming rates down.
Cost Driver #3: Freight, Palletisation, and Warehouse Handling
Freight is the single largest TCO line and the one most often mis-modelled. A flat unassembled (knocked-down) carton returns 4-6x more units per pallet than an erected box, which directly cuts inbound freight cost per shippable unit by the same ratio [S1].
Warehouse handling is the second hidden cost: a manual erect-and-pack station runs 8-12 boxes/min per operator, while a semi-automatic carton erecting machine line runs 25-40 boxes/min at a 12-18 month payback at typical Western-Europe labour rates. The TCO crossover point for automation is therefore 1.5-3M boxes/year, consistent with the 12-36 month break-even framing used in the SitePoint 2026 TCO model [S3].
Cost Driver #4: Damage, Returns, and Sustainability Levers
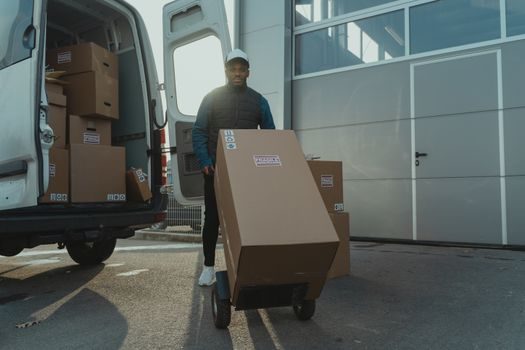
Damage write-off is the line that flips TCO rankings between suppliers. Industry TCO guidance treats maintenance, support, and disposal as first-class cost lines, not afterthoughts [S4]. For a shipper handling fragile or high-value SKUs, a 1.5% damage rate at 50,000 units/month translates to 9,000 damaged units annually, and at a $20 average product value inside, that is $180,000/year — frequently more than the entire box-purchase budget.
Three levers consistently cut this: spec'ing ECT up by one grade (32→44 ECT), inserting a corrugated partition or die-cut tray, and standardising pallet pattern to avoid overhang. Sustainability adds a fourth, often-misread cost line: the EU Packaging and Packaging Waste Regulation (PPWR) shifts EPR fees toward recyclability and recycled-content thresholds, which moves the cost optimum away from virgin test liner toward 70-100% recycled board for non-export SKUs [S1].
Decision Matrix: Single-Wall vs Double-Wall vs Heavy-Duty/Triple-Wall
A criteria-based comparison for a typical e-commerce or industrial-pack buyer at 50,000 units/month, 12-month horizon, [S1][S3]:
For a buyer doing their own cost-of-ownership model, the SitePoint 2026 framework's core lesson transfers directly: compare 12-month and 36-month totals, not per-unit price [S3]. A 36-month horizon almost always shifts the optimum toward double-wall or heavy-duty, because damage-rate compounding dominates year-1 savings on cheaper board.
Who the Carton Box TCO Model Is For — and Who It Is Not For
This model fits procurement and packaging engineers at mid-volume shippers (500K-10M units/year) making board-grade and supplier decisions on 12-36 month horizons, where damage, freight, and palletisation are tracked but not yet joined into a single cost view [S1][S4]. It is not a fit for one-off shippers buying under 5,000 units total, where TCO overhead exceeds any savings, nor for closed-loop reusable-container programs (e.g. decade resistance box fleets) where capex amortisation over 50-200 cycles replaces per-trip box cost entirely.
It also is not the right tool for selecting the containment system itself — a limit switch box on a conveyor is a different equipment class and a different TCO conversation. For corrugated shippers who can measure damage rate, freight class, and order volume, the model delivers a defensible cross-supplier comparison; without those three inputs, the result is a marketing number, not a TCO.
Limitations and Failure Modes of the TCO Model
The TCO model fails when any of the three core inputs — damage rate, freight class, order volume — is assumed rather than measured.
A second failure mode is mixing decision horizons: 12-month TCO favours low upfront cost and disadvantages reusable systems; 36-month TCO often flips the ranking. A third is double-counting EPR/disposal fees that the supplier already embeds in unit price, which inflates the apparent gap between virgin and recycled linerboard. The Canon TCO calculator's underlying logic — separating acquisition, operation, and end-of-life into discrete buckets [S2] — is the discipline that prevents this, and it applies to shippers as cleanly as it does to printer fleets.
Trackable signals for the next 6-12 months: PPWR enforcement milestones moving recycled-content thresholds from voluntary to mandatory for EU-bound SKUs, and continued freight-rate volatility that can shift the freight-line of the TCO stack by ±15% in a single quarter. Spec-driven buyers who lock board grade, flute, ECT/Mullen targets, and pallet pattern into the PO — rather than leaving them to supplier substitution — are the ones whose 36-month TCO numbers actually survive an audit.
See also our earlier report, Laser Distance Sensor Price 2026: Cost Drivers, Spec Gates, and Sourcing Map.