The TCO frame used here borrows the asset-lifecycle method (feasibility, design, operations, incidents, retirement) applied to physical assets such as Longannet Power Station, which operated ten years longer than design and absorbed the bulk of lifetime cost in operations and maintenance, not construction [S1]. Concrete admixtures behave the same way: the purchase line is dwarfed by what happens on the chute and at 28 days.
What TCO Actually Counts in an Admixture Line Item
TCO for an admixture decision has six line items, not one: acquisition (USD per kg or per L at the dosing pump), storage and shelf life (typically 6-12 months for lignosulfonate-based, 12-24 months for polycarboxylate-based liquids), dosing infrastructure (peristaltic or progressive-cavity pumps rated 0.5-20 L/min), QC testing (slump, air, 7/28-day cube), rework and demould costs, and disposal or wash-water handling at end of pour [S1][S2].
The data-dynamics calculator logic, isolating acquisition vs. operations split, is the same lens the dental-equipment and Canon MegaTank TCO tools apply to printers, where ink/toner dominates 60-80% of lifetime spend [S2].
Side-by-Side: Three Admixture Families on TCO Criteria
Lignosulfonate (Type A/B), naphthalene sulfonate (Type A/F), and polycarboxylate ether (Type A/F) families are not interchangeable on lifetime cost. The comparison below uses the four criteria that move real money on a ready-mix docket. [S1]
On long-haul deliveries (>45 min), the lignosulfonate's short slump window triggers rejected loads and demurrage charges of USD 80-150 per truck per hour, which can wipe out a year of chemical savings on a single hot-weather pour. For a deeper look at the chemical class trade-offs, the concrete admixture trade-offs guide maps each class against slump, durability and unit cost. Engineers specifying for ready-mix concrete installations should size pumps and retarding admixtures to the haul time, not the lab mix card.
Who TCO Modelling Is For, and Where It Misleads
TCO modelling is for specifiers, batch-plant QC managers and procurement leads who own the 28-day strength result and the pour schedule, not for the buyer who only signs the PO. It is misleading on small one-off pours under 30 m³, where storage losses and pump calibration dominate, and on any mix where the contractor carries no rework risk through liquidated damages [S4].
The Springer regional-TCO study on hybrid vehicles warns that identical conditions must be enforced across regions for TCO to be comparable, and the same rule applies across admixture brands: switch the cement source, the aggregate moisture, or the ambient temperature, and a "lowest TCO" admixture becomes the most expensive [S3]. Concrete, like fleet vehicles, has a sensitivity profile that swings the answer by 20-40% on a single input change. Plant managers running a concrete batching plant should re-baseline the model every quarter, not every year.
Use Cases: Where the TCO Math Flips the Decision
Three concrete use cases flip the drum-ticket decision inside the same bid sheet. First, hot-weather pours (ambient >30 °C) with 60-min haul: PCE at USD 5-7/m³ chemical cost vs. lignosulfonate at USD 2-3/m³, but the PCE route avoids 2-3 rejected loads per 200 m³ pour, each at USD 400-700 demurrage, net saving USD 800-1800 per pour [S4]. Second, high-performance mixes with 28-day specified strength above 50 MPa and w/c ≤0.40: w/c reduction from 0.45 to 0.36 with PCE removes 35-50 kg/m³ of cement, and at USD 110-140/t cement that is a USD 4-7/m³ material saving, against USD 3-4/m³ extra chemical cost [S1][S4].
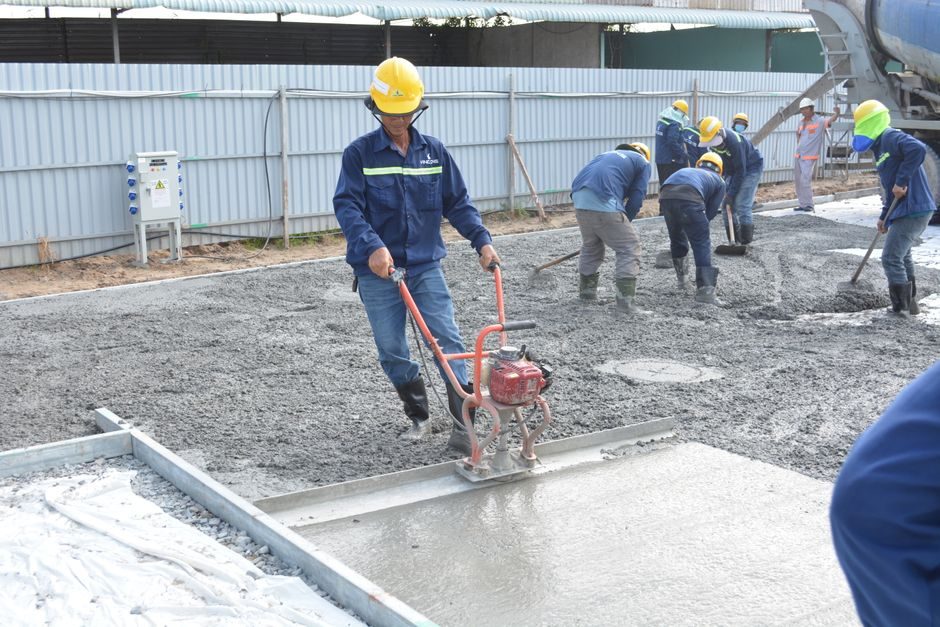
Third, slipform and pumped-concrete operations where concrete vibrator consolidation depends on stable workability: maintaining 100-150 mm slump for 90 min prevents segregation, re-pumping and form-pressure failures, and a PCE-based mix with concrete fiber reinforcement consolidates cleaner with one vibrator pass per zone. The Sun Java capacity-planning table cited in [S6] uses the same "more, smaller systems vs fewer, larger systems" framing: many small admixture doses per truck with simple inventory often beats a single mega-batch of premium chemistry when storage and shelf-life risk are priced in [S6]. For projects that pair a concrete admixture upgrade with a concrete curing compound switch, the moisture-retention gain compounds the strength result and shortens the 28-day wait, freeing formwork for reuse.
Failure Modes and Constraint Map

The three constraints that turn TCO upside down on real sites are: ambient temperature (above 30 °C, lignosulfonate slump loss doubles), haul time (each 15 min beyond 45 min costs roughly 0.5-1.0% of admixture efficiency), and cement alkali content (high-alkali cement neutralises lignosulfonate's air-entraining benefit, forcing a switch to a synthetic Type AE [S4]. On the cost side, dosing-pump drift of ±5% over six months can shift effective dose by 0.05-0.1% bwoc, equivalent to USD 0.30-0.80/m³ of unbilled chemistry, the same kind of hidden operations-cost creep that TCO frameworks such as [S1] flag on long-life industrial assets.
Spec writers should require ASTM C494 conformance for chemical admixtures and ASTM C260 for air-entraining, and document the in-plant dose log as a deliverable, not an option. The estimator template at [S5] is built for IT assets, but its structure (capex, opex, decommissioning rows, NPV column) ports directly to an admixture TCO sheet with three extra rows: rework, demurrage, and cube-test failures.
Sourcing, Standards and the Next Decision Node
Procurement should benchmark bids against ASTM C494 Type A/F/G, EN 934-2 (the European equivalent, often cited on Chinese-origin PCE shipments), and the project's own 7-day/28-day strength record; a savings claim of more than USD 1.50/m³ on the chemical line alone, without a model of slump retention and rework, is a pricing red flag rather than a deal [S4]. Track the next two signals: any 2026 PCE price reset by major Chinese suppliers (SNF, BASF Master Builders, Fosroc) below USD 2.0/kg solid would compress the payback math and push lignosulfonate out of structural mixes; and any project-specific 90-day cube result below design strength is the leading indicator that the TCO model was sold, not run.