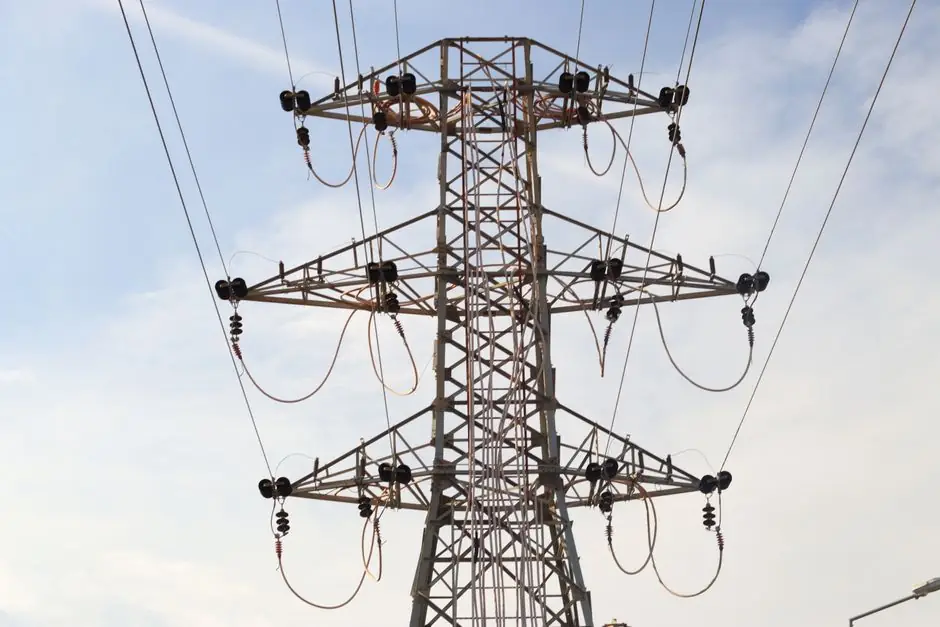
Grid-equipment price inflation has materially outrun both the Producer Price Index and the Consumer Price Index since 2020, lifting annual U.S. electric-utility capex past the $200 billion mark, up 42% from 2020 levels, and pushing the five-year capex outlook above $1 trillion [S3].
Distribution alone, the segment where equipment is most fragmented, took $104 billion of that spend in 2025, with 87% concentrated in four categories: poles and fixtures, conductors, transformers, and station equipment [S3]. Capital investment in the distribution system increased by $31.4 billion, or 160%, from 2003 to 2023, per FERC Form 1 data, with $6.5 billion of that growth landing in 2023 alone as utilities hardened lines against storms and integrated distributed renewable resources [S2].
Where the inflation hit hardest: transformers, switchgear, and station equipment
Lead times on highly specialized transformers, breakers, and switchgear stretched from a typical sub-12-month baseline to as long as three to four years, a structural undersupply signal that has translated directly into project-cost inflation [S3]. CoBank documents that cost inflation in key utility components has outpaced both PPI and CPI since 2020, with the headline PPI for May 2026 up 6.5% year-over-year, the largest move since the post-Russia-invasion-of-Ukraine surge of 2022 [S3].
The U.S. Energy Information Administration, drawing on FERC Financial Reports, reports distribution substation equipment spending of $6.1 billion in 2023, a 184% increase from 2003 and a 15% year-over-year jump from 2022 [S2]. Overhead lines, poles, and towers captured $17.4 billion in 2023, up 11% year-over-year and 220% above 2003, while underground line investment more than doubled to $11.8 billion, and line-transformer capital spend climbed 23% in a single year to $7 billion in 2023 [S2].
How the spending surge stacks against the macro inflation backdrop
Lawrence Berkeley National Laboratory's May 2026 scoping study finds that investor-owned utility distribution spending grew 6% per year in real dollars since 2014, four times faster than the prior 20 years, and that increases in IOU distribution costs since 2014 account for 32% of the overall national-average increase in retail electricity rates [S1]. Real average IOU prices were up 2% from 2019 to 2024 while publicly owned utility prices were down 8.7% over the same window, a divergence that flags equipment-and-capex pass-through as the principal driver rather than fuel or operations costs [S1].
Rhodium Group's April 2026 analysis frames the post-pandemic inflation shock as the structural reason key grid-equipment prices remain elevated through the 2026–2030 forecast window, and notes that real average U.S. electricity prices actually fell 9% from 2010 through 2020 before reversing [S4]. The same study highlights that consumer electricity prices have risen 45% since May 2020 on the CPI electricity sub-index [S6], and notes that supply chain constraints have intensified alongside surging grid investment, with demand for critical materials outstripping supply and resulting in longer lead times, rising costs, and ongoing labor shortages [S3].
Headline utility capex, distribution, and ratepayer impact
S&P Global's April 2026 forecast puts the RRA Financial Focus electric-utility group at $108.4 billion in 2026, rising to $112.5 billion by 2028, with the 2026–2030 cumulative U.S. utility capex envelope approaching $1.3 trillion [S8]. Gabelli's January 2026 sector outlook tracks 2025 capital expenditures at roughly $227.8 billion and projects 2026 at $233 billion, with cumulative North-American grid infrastructure investment in the trillions over the planning horizon [S5].
Institute for Energy Research data shows electricity bills rose 23% between 2019 and 2024, largely to cover rising costs, with the same source estimating a $1.4 trillion U.S. utility-industry investment need over the planning horizon [S7]. An analysis of utility capital expenditure data cites $1.16 trillion designated to expand grid infrastructure, and notes that the CPI electricity sub-index has climbed 45% since May 2020 [S6].
Comparison: which equipment categories absorbed the most inflation
Looking across the main distribution spend categories against four decision criteria, the inflation concentration is clear. Overhead lines, poles, and towers took $17.4 billion in 2023 with a 220% rise from 2003 [S2]. Underground line investment more than doubled to $11.8 billion [S2]. Line-transformer capital spending grew 23% in a single year to roughly $7 billion in 2023, with lead times on large power transformers stretching to three to four years [S2][S3]. Distribution substation equipment hit $6.1 billion in 2023, up 184% from 2003 and 15% year-over-year [S2].
Against those four categories, transformers and switchgear score worst on lead time (3–4 years vs. sub-12 months pre-2020), worst on cost-inflation versus PPI and CPI, and worst on reshoring lead-time, while overhead infrastructure scores highest on raw dollar growth since 2003 and is the most exposed to storm-hardening mandates [S3][S2]. On a per-dollar basis, transformer and station-equipment capex is where equipment-cost inflation is most clearly visible in project budgets, because the unit count is small and each unit is now bid at a multi-year lead-time premium.
Supply-chain response and what still constrains the market
Manufacturing capacity for transformers, breakers, and switchgear is gradually expanding, supported by U.S. reshoring, OEM growth, and increased global production, but manufacturing-labor supply remains strained, and cost inflation continues to weigh on project economics [S3]. Distribution, because it bears the first impacts of load growth, electrification, DER programs, and reliability investment, is under earlier and more continuous pressure than transmission or generation, and spending in this category has nearly doubled since 2020 [S3].
Major forecasters (S&P Global, Edison Electric Institute, Deloitte) are aligned that total capex will exceed $1 trillion over the next five years, and Rhodium Group finds no major price-decrease drivers in the near term given fuel volatility, continued inflation, supply-chain and infrastructure constraints, and proposed data-center buildouts already squeezing key grid-equipment supply [S3][S4]. A related article on distribution-driven U.S. grid capex and transformer lead times tracks the same supply-chain squeeze from the equipment-manufacturing side.
Trackable signals for the next planning cycle
Two near-term data points will confirm whether the inflation premium is starting to ease: the FERC Form 1 distribution capex line for 2026, which EIA will publish in late 2026 and 2027, and any sustained drop in large-power-transformer lead times back toward 12–18 months, which would imply that the reshoring and OEM capacity additions tracked by CoBank are actually clearing the backlog [S3][S2]. Watch the BLS PPI for electrical-equipment manufacturing through the second half of 2026; a sustained deceleration from the May 2026 print of 6.5% year-over-year would be the first concrete signal that the structural undersupply is closing, and would give regulators and ratepayer advocates a basis to push back on the equipment-inflation pass-through that has lifted IOU distribution costs 6% per year in real dollars since 2014 [S1][S3].