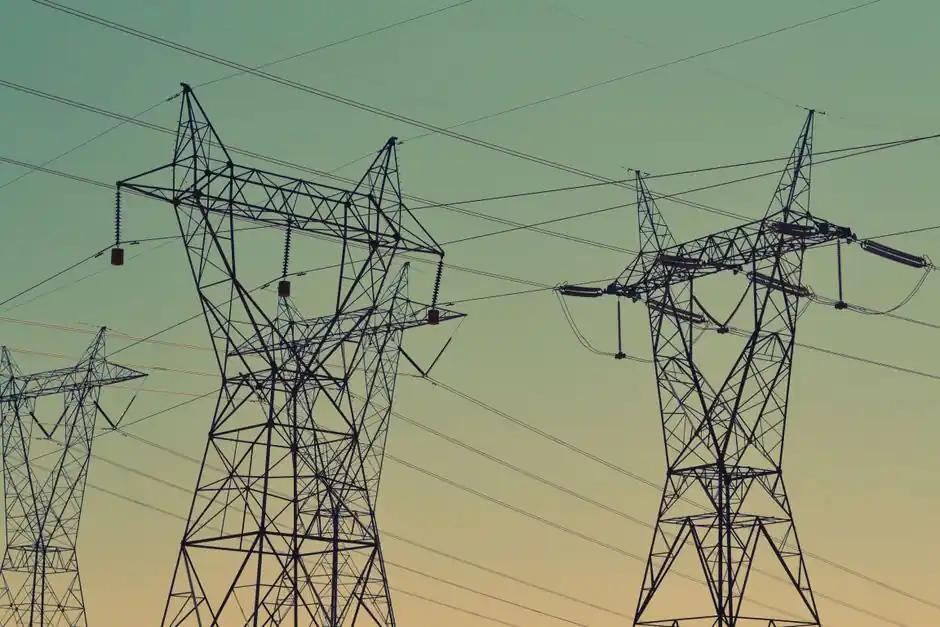
Total US electric-utility capital expenditure in 2026 is projected at roughly $1.295 trillion across 2026 through 2030, an approximate 29% increase over the $200 billion spent in 2025 [S5][S10]. S&P Global's Regulatory Research Associates, the Edison Electric Institute and Deloitte all bracket that five-year total above $1 trillion, and the consensus has firmed in the first three quarters of 2026 [S3][S10].
Distribution is where the money is landing. In 2025, $104 billion flowed into distribution, of which 87% went to four line items: poles and fixtures, conductors, transformers, and station equipment [S3]. Distribution spend has nearly doubled since 2020, against an industry-wide annual investment total above $200 billion, up 42% over the same window [S3]. Lawrence Berkeley National Laboratory (LBNL) tracks IOU distribution spending at roughly 6% per year in real terms since 2014, four times faster than the prior twenty years [S1].
What the 2026-2030 capex is actually being spent on
Utility capital programs are tilting away from greenfield transmission and central generation, and toward reconductoring, distribution automation, feeder-level storage, and storm hardening, driven by Pennsylvania's H.B. 2233 mandate on advanced transmission technologies, signed after the Pennsylvania House passed it unanimously on 5 May 2026 [S4]. On the IOU side, LBNL shows distribution expenditures have outpaced generation, transmission, and business operations growth, and account for 32% of the national-average increase in retail electricity rates since 2014 [S1].
On a per-kWh basis, IOU distribution costs are the largest single contributor to retail rate movement, a structural fact that frames every state rate case from 2024 onward. Investor-owned utilities serve about 70% of US retail electricity sales, and from 2019 to 2024 average IOU prices were up 2% in real terms while publicly owned utility prices were down 8.7% [S1].
Distribution vs transmission: the shift that matters for equipment specifiers
For equipment specifiers, the practical read is that the fastest-growing dollars sit on medium-voltage gear, not high-voltage lines. CenterPoint Energy's Greater Houston Resiliency Initiative posted $1.2 billion in Q1 2026 spend inside a $6.8 billion annual plan and a $65 billion ten-year envelope: more than 10,000 storm-resilient poles installed against a 35,000 full-year target, 99 miles of undergrounding completed (a pace near 400 miles per year), and 220-plus miles of overhead line hardened [S4].
The structural case sits underneath the storm headlines: roughly 90% of utility outages occur on the distribution system, and approximately 80% of those are temporary faults that intelligent reclosers can clear without a truck roll [S4]. US outages cost the economy around $67 billion per year, and much of the distribution base is 50 to 60 years old, so the replacement cycle was inevitable even before storms accelerated it [S4]. For reference architecture, see the related comparison of distribution vs transmission grid investment in 2026.
Supply chain: transformers, breakers, switchgear, and copper
Equipment lead times for transformers, breakers and switchgear stretched from a typical sub-year baseline to three to four years at the worst point of the cycle, and while manufacturing capacity is gradually expanding through US reshoring, OEM growth, and increased global production, manufacturing labor supply remains strained [S3]. Since 2020, cost inflation in key utility components has outpaced both the Producer Price Index (PPI) and the Consumer Price Index (CPI), a signal of structural undersupply in critical inputs [S3].
Headline PPI was up 6.5% year-over-year for May 2026, the largest move since the post-Russia-invasion surge of 2022, with energy prices as the primary driver and core PPI up 0.8% month-over-month [S3]. For medium-voltage distribution, the bottleneck is concentrated in padmount and substation transformers, with knock-on effects on distribution cabinet and cable distribution cabinet deliveries, and on power distribution box lead times. Large-format busway runs and dry-type transformer orders are part of the same constrained queue.
Rate pressure, regulatory friction, and the political ceiling
Thirteen Pennsylvania utilities sought $975 million in 2025 rate increases after booking $1.4 billion in combined 2024 profit, while more than 400,000 households went through shutoffs, a fact pattern that pushed Governor Josh Shapiro on 29 April 2026 to write to 24 electric, gas and water utilities declaring "the 20th-century utility model is broken" and to require utilities to prove they are maximizing existing grid resources before requesting new capital [S4]. Stocks of Exelon, FirstEnergy, and PPL fell the next day [S4].
PECO withdrew a rate hike under earlier pressure, and the legislative branch followed with H.B. 2233, mandating study of advanced transmission technologies before any traditional transmission upgrade gets approval [S4]. The procurement consequence is that when a state forces utilities to defer transmission, the capital does not vanish: it relocates to reconductoring, distribution automation, dynamic line ratings, and feeder-level storage, and the regulator's cap on bill growth becomes the design constraint on every substation order that follows [S4].
Material ceiling: copper, steel, transformer steel, and labor
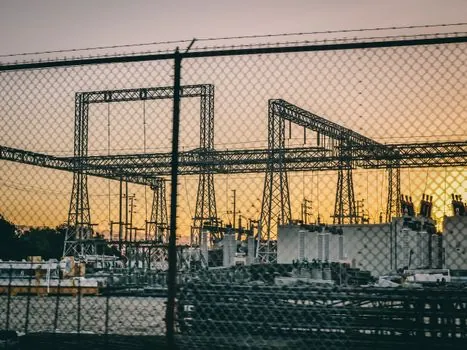
Foley & Lardner's September 2026 analysis framed the issue bluntly: the grid's bottleneck is not just money, it is materials [S10]. Roughly $1.295 trillion of utility capex during 2026 through 2030 is competing for the same limited pool of grain-oriented electrical steel, copper, aluminum, and skilled line and substation labor, with residential electricity prices projected to rise 15 to 25% cumulatively from 2026 to 2030 as utilities recover that spend [S8][S10].
For buyers, the practical implication is that standardization on a smaller set of transformer kVA ratings and switchgear frame sizes is the single most effective lever for shortening deliveries, and that early engineering packages submitted in 2026 will land on factory floors already booked into 2028 [S3].
Who this cycle is for, and who it is not for
This capex cycle rewards vendors that can pre-stage copper, transformer steel, and padmount transformer capacity, and that can deliver ANSI/IEEE C57 distribution transformers and pad-mounted switchgear on a 12 to 18 month cadence rather than the 36 to 48 month worst case. It penalizes buyers who treat medium-voltage gear as a spot buy, and it is not a friendly cycle for low-voltage commercial gear, EV charging make-ready, or behind-the-meter storage that sits outside the rate base. [S3]
Trackable signals for the next two quarters: CenterPoint's full-year 2026 hardening scorecard, the LBNL follow-on distribution-cost update (the May 2026 scoping study is the current baseline), the next S&P Global Regulatory Research Associates capex revision, and any further state-level adoption of "study advanced transmission technologies first" language on the Pennsylvania H.B. 2233 pattern.