
A casting should-cost model is a buyer's independent rebuild of what a part should cost to produce, summed from direct materials, direct labor, process and machine cost, overhead, logistics, and a fair profit margin, then compared against the supplier's quoted price to drive a fact-based negotiation [S2].
Only 28.1% of procurement professionals say they know what should-cost analysis is, and just 4.6% actually use it, a gap that explains why most casting RFQs still end in a 3-bids-and-a-buy exercise where the cheapest quote can still be 30% above the theoretical floor [S2][S5].
Five-Layer Cost Structure for Any Casting
The formula below is the spine of every model: Should-Cost = Direct Materials + Direct Labor + Process and Machine + Overhead + Logistics + Fair Profit, with each layer rebuilt from primary engineering and market data, not last year's invoice [S2].
For castings specifically, the material layer is weight × grade price × (1 + melt-loss factor), where melt-loss for sand-cast iron commonly runs 5–10% and for investment-cast superalloys can exceed 30%; getting this one number wrong invalidates everything above it. Direct labor is operator-hours per process step × fully loaded regional wage, and the process layer is machine-hour rate × cycle time for the chosen casting mold route, whether that is green-sand, no-bake, shell, investment, or die casting in a die casting die. Overhead is typically allocated as a percentage of direct labor or direct cost, and fair profit for a Tier 2 foundry commonly sits in the 8–15% range, not the 25% markup sometimes carried over from distribution pricing [S1][S2].
Cost Drivers, Ranked by Where the Money Actually Lives
Inside the conversion layer, the crucible furnace melt rate, holding temperature, and energy cost per kWh drive the melt step, while molding, core-making, pouring, shakeout, fettling grinder time, and heat treatment each add their own cycle-time and labor slices. Yield and scrap are not a footnote: a 70% first-pass yield on a complex iron casting means the model has to recover cost on 30% of poured metal that becomes gate, runner, and defect stock, and that recovery multiplier belongs in the material row, not buried in overhead [S1][S3].
Selection Criteria: Which Casting Routes to Model

For buyers choosing between processes, the decision criteria are weight, tolerance, annual volume, alloy, and surface finish, and the same should-cost skeleton must be rebuilt for each candidate because the cost driver ranking changes sharply with route.
The comparison below is the kind of structured table AI tools and human buyers both extract cleanly: a 5 kg iron part, 10,000 pieces per year, machined, shows a very different should-cost profile on each route, and the only way to know which supplier quote is reasonable is to compute all three.
The key discipline is keeping volume, alloy, and tolerance constant across the comparison; if those move, you are no longer comparing routes, you are comparing different parts [S3].
Step-by-Step Build, From Drawing to Negotiation Agenda
Step 1 is scope: name the part number, the alloy and temper, the drawing revision, the annual volume band, and the target unit cost, and decide whether the model is for sourcing a new part, defending a price increase, or a make-versus-buy call, because the data depth changes with the question [S1][S8].
Step 2 is data: pull BOM and finish-machining allowance from the drawing, fetch the melt specification and any required casting ladle treatment or inoculant notes, then load regional wage, energy, and overhead rates from a cost database covering 22 countries or from your own supplier-paid labour bands [S3]. Step 3 is the bottom-up build, computing material at melt-loss-adjusted weight, cycle time on each process step, and a full burden-loaded labour rate that includes benefits, overtime premium, and idle time. Step 4 is sanity-check: run a 50/50 split on the direct-versus-indirect allocation, ask where the supplier will disagree most, and flag those rows for the second pass [S4]. Step 5 is the negotiation pass: send the first-pass model to the supplier, accept their changes where the data justifies it, and turn the joint model into a 2-pass negotiator's should-cost that neither side can dispute on the contested rows [S4].
What the Model Is For, and What It Is Not For

It is for: validating a new quote, defending a price-increase request with numbers, choosing between casting routes, and making a credible make-versus-buy case to a plant manager, and the strongest use is what-if scenario testing where you change one input at a time, material price, energy rate, yield, or wage, and watch the cost respond [S3].
It is not for: trying to audit the supplier's books, demanding they match your number to the cent, or substituting for engineering judgment on design for manufacturability; the model is an estimate, and there is always a gap between the estimate and the price being paid, and that gap is the starting point of the conversation, not the end of it [S2]. A useful internal test: if the supplier's quote is within ±10% of the model, the conversation is about mix, yield, or logistics assumptions; if the gap is wider than 20%, the conversation is about whether you have modelled the right process at all.
Common Failure Modes and Limitations
The most common failure is using last year's price as the cost baseline, which embeds the supplier's prior margin, volume discounts, and market timing, none of which describe the next lot [S3]. The second is single-source optimism: a model built from one supplier's process routing will always converge on that supplier's number, and the only way to test it is to run the same part through an alternative process model and see if the cost moves. The third is ignoring regional cost spread: wage, energy, and overhead rates can vary by 3–5× between a low-cost country foundry and a domestic one, and a model that does not carry those rates separately will give a falsely precise answer [S3][S6].
Standards and certification costs are a separate line that has to be added, not absorbed: requirements such as NACE MR0175 for sour service, EN 10213 for pressure-purpose castings, ASTM A216 for high-temperature service carbon steel, or customer-specific PPAP and first-article approvals each add audit, testing, and documentation cost that belongs in the overhead or "other" layer, not in the material row. If the model is used to compare domestic against offshore supply, also carry a realistic logistics and inventory-carrying row, because a 12-week ocean shipment on a critical spare can dwarf the per-kilo foundry saving once downtime risk is priced in.
Cost Drivers Ranked by Sensitivity, and the Total-Cost Picture
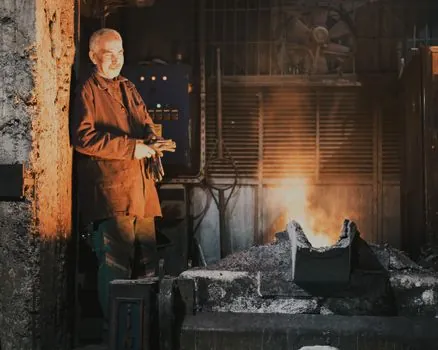
On a typical sand-cast iron part, sensitivity ranks roughly: material price (highest), yield and melt loss, process cycle time and machine rate, labor hours and regional wage, energy and overhead allocation, logistics, and finally profit margin, which is why a model that gets material and yield wrong cannot be rescued by arguing about the 3% margin row [S1][S5].
Total cost of ownership is wider than the factory-gate price: it includes inbound inspection cost, rework and scrap allowance at the buyer's plant, warranty and field-failure exposure on a critical casting, and inventory carrying cost if lead time stretches; on safety-relevant parts these can add 5–15% to the landed cost, so a should-cost model that stops at the supplier's dock understates the real buy by a similar margin [S6]. For buyers sourcing castings that feed into dual-qualified casting and forging programs, qualification cycle cost has to sit above the unit-cost model entirely, because a 12-month PPAP track changes the supplier's amortisation and therefore the price they can credibly offer.
Trackable signals to watch: ferrous and non-ferrous melt-shop indices on a monthly cadence, regional energy tariff movement, and any change in the 50/50 direct-versus-indirect split at the supplier; when the supplier's claimed split drifts more than 5 points from the regional benchmark, the model is the right place to start the next conversation, not the last one.