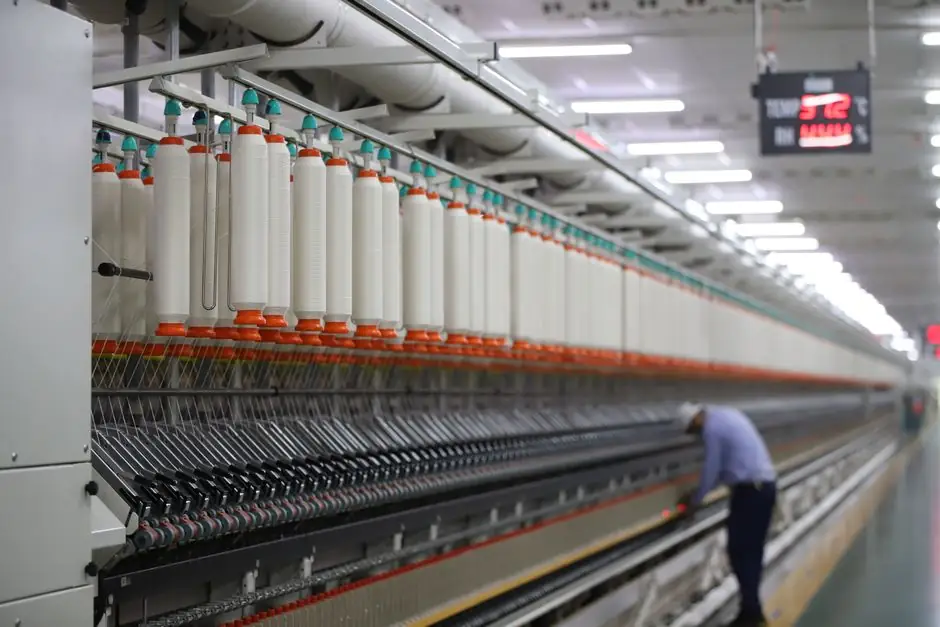
An injection molding plant's variable energy load typically runs 0.9–1.6 kWh per kg of molded product, with base load accounting for 20–40% of total plant energy use, and roughly 30% of total consumption classified as discretionary [S4].
For an injection molding machine selection decision, the four knobs that move the number are drive system (hydraulic, hybrid, all-electric), clamping tonnage, cycle time, and material-specific plastification energy, all of which feed a single Performance Characteristic Line (PCL) plotted in kWh against kg [S4][S3].
Reading the Performance Characteristic Line: base vs variable load
The PCL is the engineering tool that turns an injection molding plant's energy chaos into one equation: ENERGY USAGE = (VARIABLE LOAD × PRODUCTION VOLUME) + BASE LOAD. Variable load is the slope, expressed in kWh/kg, and for most molding sites it falls between 0.9 and 1.6 kWh/kg. Base load is the y-intercept, the energy drawn at zero production, and it represents 20–40% of total energy use on a typical site; one audited site in the Mobil/Tangram reference set showed 282,038 kWh of base load and a variable load of 1.3504 kWh/kg [S4]. Plotting monthly kWh against kg over at least 12 months and fitting a linear regression is the minimum dataset required to make the equation useful; the same guide flags an R² above 0.7 as the threshold for "good operational consistency," meaning energy-saving actions will land predictably, while an R² below 0.7 means the data is too noisy to act on [S4].
Splitting the two terms matters because they have different mitigation strategies. Base load responds to housekeeping: shutting off idle heaters, fixing compressed-air leaks, switching off lights, and rescheduling mold changes to consolidate startup transients. Variable load responds to engineering: drive retrofit, material grade selection, and cycle-time reduction. Conflating them, and treating a kWh bill as one number, is the most common reason a molding line audit finds savings it cannot actually claim.
Drive system comparison: hydraulic, hybrid, all-electric
Drive architecture is the single largest swing factor in variable load. Hydraulic injection molding machines run their pump motor continuously regardless of load, so they draw significant energy even at idle, and their conversion losses through the hydraulic circuit are intrinsic; all-electric machines run motors only on demand and use electric servos for injection, clamping, and ejection, so waste is bounded by the actual motion profile [S3]. ENGEL publishes that switching from hydraulic to electric or servo-hydraulic drive configurations can cut injection molding energy consumption by up to 67% on supported machine generations [S7]. The catch is that all-electric penetration is concentrated in lower clamping tonnage machines, where the technology has had the longest time to mature; above that, hybrid is the dominant retrofit path [S5].
Three criteria separate the options in practice. All-electric machines are more energy efficient than hydraulic machines, with hybrid drives offering intermediate efficiency, because hydraulic machines require continuous hydraulic fluid supply even when idle. Precision and repeatability: all-electric is best, then hybrid, then hydraulic. Capital cost and suitability for high-tonnage or glass-filled compounds: hydraulic and hybrid retain the advantage because of screw torque and clamp force headroom. For a shop that already runs an automatic molding line at 800+ tonnes, the realistic decision is hybrid retrofit with variable-frequency pump drives, not full electric conversion.
Material and parameter decisions that move kWh/kg
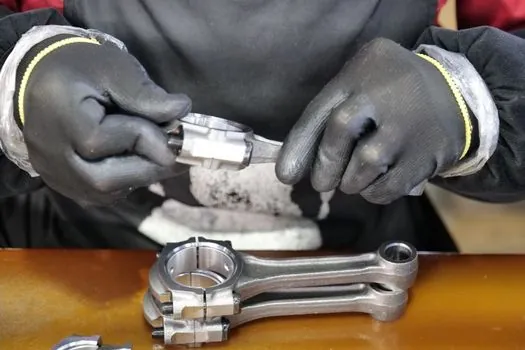
Material choice is downstream of part design in most shops, but it still drives measurable energy deltas. Lower melt flow index (MFI) means higher viscosity, which means higher plastification torque and higher barrel heater setpoints, both of which raise the kWh/kg slope of the PCL. Higher heat deflection temperature (HDT) means the part can be ejected sooner, which compresses cooling time. Higher thermal conductivity in the polymer grade transfers heat to the mold faster, again shortening cycle [S5]. The combined effect of a material switch plus parameter retune is documented in the 7–13% range on real production cells, and the 20-year comparison shows the industry has already cut injection molding energy per part by at least 20% through motor shutoff, process parallelization, and electric drive penetration [S5].
Parameter-level levers, measured at each cycle stage, are where most of the remaining 7–13% lives. The Kern IoP-style cycle energy plot breaks the cycle into mold close, volumetric injection, pack/hold, cooling, plastification, and mold open; the area under each segment is the optimization target. Slowing the injection velocity reduces the peak power spike in that segment; tuning counterpressure and a progressive recovery ramp cuts the plastification energy when the screw runs backward; trimming cooling time by even a few seconds compounds across millions of cycles [S5]. For plants running shell molding machine cells or other sand/metal workflows, the same discipline (energy-per-shot plotted against shot count) applies, though the absolute kWh/kg numbers diverge by an order of magnitude.
Where machining and assembly fit in the same benchmark
Spiering et al. (2015) extend the benchmarking logic from injection molding to machining systems, defining energy demand evaluation as a lever for parallel improvements in energy, material, and process time efficiency. The same multi-objective framing shows up in Cai et al. (2017), whose mechanical-manufacturing energy benchmark treats low-efficiency stations as the priority targets [S1]. For an assembly cell, the analogous metric is kWh per completed unit, decomposed into station base load plus per-unit variable load, the assembly equivalent of the PCL.
A consistent way to compare across processes is to track three numbers on every cell: specific energy consumption (kWh per kg molded, kWh per part machined, or kWh per assembly completed), energy intensity per revenue unit (kWh per $ of output), and base-load fraction. The first catches process drift, the second catches product-mix drift, and the third catches housekeeping opportunity. ISO 50001-style audit protocols cover the same ground at plant level, and the ASHRAE audit tiers structure the walkthrough intensity that feeds the underlying data [S4].
Limits, failure modes, and what not to chase

Benchmarks break in three predictable ways. First, a low R² on the PCL means production and energy are not actually correlated, usually because of batch-mode operations, shared utilities, or unmeasured shifts, and any savings estimate built on that regression is unreliable [S4]. Second, drive retrofits on machines older than 15 years often fail to deliver the OEM's headline number because the rest of the machine (heater bands, hydraulics, controls) is the actual bottleneck; the 67% figure from ENGEL is bounded to the supported machine generations and assumes the rest of the cell is in good order [S7]. Third, the 7–13% parameter-reduction range assumes visibility into per-stage energy, which most older controls do not provide without a metering retrofit [S5].
The 30% discretionary figure is the most-quoted and least-defended number in the corpus. External benchmarking, comparing your plant's kWh/kg against peer data, only works if the peer set is processing the same material at the same shot weight with the same tonnage; cross-material comparisons without normalization produce misleading rankings [S2]. For a related deep-dive on how digital twins are now used to chase these per-stage kWh targets in production, see AI Process Parameter Optimization for Injection Molding: 2026 Spec Guide.
Standards, sourcing, and how to ground the numbers
The canonical reference set for injection-molding energy work is the Spiering et al. paper in Robotics and Computer-Integrated Manufacturing (DOI:10.1016/J.RCIM.2014.12.010), which establishes the energy-benchmarking methodology that downstream machining and assembly studies build on [S1]. The Mobil/Tangram Energy Saving Guide is the practitioner-level reference for the PCL, base/variable split, and the 0.9–1.6 kWh/kg band [S4]. The ASME manufacturing-science paper (2017) validated the underlying energy-estimation models for injection molding, which is what gives the per-stage cycle plots their quantitative credibility [S6]. Top Star's 2025-09 buying-guide piece and ENGEL's published reduction figure round out the OEM and integrator perspective on drive selection and headline savings claims [S3][S7]. External benchmarking methodology, including the normalization traps, is laid out in the 2009 Plastics Technology benchmarking article that still anchors the peer-comparison discussion [S2].
Track these signals over the next 12 months: whether EU Ecodesign for Sustainable Products Regulation (ESPR) delegated acts publish injection-molding-specific kWh/kg disclosure requirements for placed-on-market machinery, whether ISO 50001 energy-management audits start requiring per-stage cycle energy data rather than aggregate kWh, and whether cold-box core machine and other sand-cell benchmarks get a published kWh/kg reference range comparable to the 0.9–1.6 kWh/kg plastic-injection band.