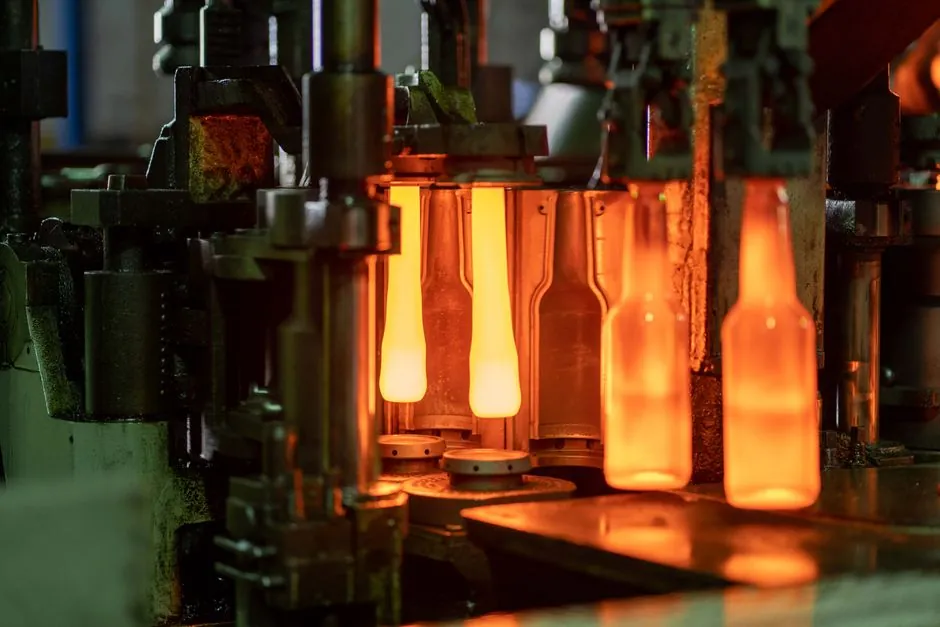
U.S. manufacturing wage growth stabilized near 4% in 2026, raising the labor-cost hurdle for automation projects [S7].
Highly automated factories pay workers 15–25% more than comparable manual-intensive plants, while machinists reached a $58,750 median annual wage [S2][S5].
2026 Wage Baseline for Automation Investment
Median annual pay reached $58,750 for machinists, $53,750 for welders, and $65,380 for aircraft structure assemblers in the May 2025 Occupational Employment and Wage Statistics reference period, published May 15, 2026 [S5].
Machinists' pay rose 7.9% year over year, the strongest growth among major skilled occupations [S5]. The all-occupations median increased 3.0% over the comparison period [S5].
These figures establish a 7.9% skilled-trade wage benchmark and a 3.0% economy-wide comparison point for screening automation economics [S5]. Machine suppliers and integrators can express a base-case labor case as loaded annual wages multiplied by exposed labor hours, then test sensitivity against the 1.2% to 7.9% occupation-specific growth range [S5].
Automation Premium Changes the Labor Case
Workers in highly automated facilities earn 15–25% more than workers in comparable, less automated plants, with the reported premium extending across industries, regions, and company sizes [S2].
The premium shifts the economic question from headcount reduction alone to avoided labor and retained capability.
Maintenance and Programming Economics
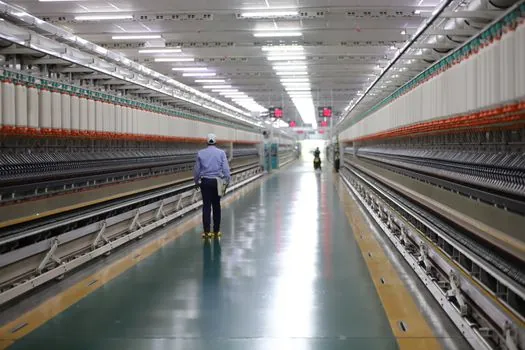
The median annual wage for machinists was $58,750 [S5]. These figures identify maintenance, programming, and engineering as separate cost categories rather than interchangeable labor assumptions.
Which Automation Cases Have the Strongest Case
The table below compares the principal project types by labor exposure, technical labor requirement, and payback risk. The decision criterion is not automation in general, but whether avoided labor and added technical capacity outweigh the full capital, integration, and operating burden.
Safety and Quality Benefits Count, but Savings Need Evidence
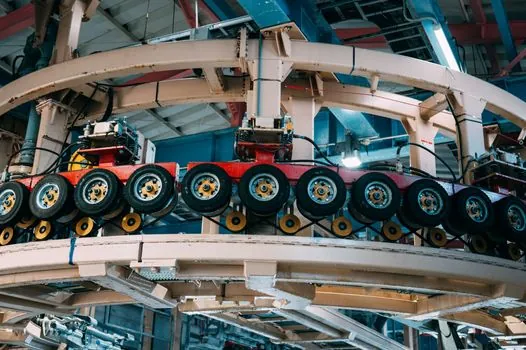
Those effects can strengthen an investment case, but they should not be converted into cash savings without validated incident costs, downtime, rework, scrap, and throughput data. A manufacturer facing flat productivity despite growth in new factories and workforce capacity may need process redesign rather than another isolated robot cell [S6].
The comparison with manual, robotic-cell, and process-data systems also exposes measurement requirements: labor savings require exposed hours and loaded rates, while quality and safety benefits require baseline incidents, defects, and downtime. For controls and plant infrastructure, the broader technical scope is covered in electrical automation.
Payback Model and Decision Thresholds
A minimum defensible model requires four dated inputs: loaded labor cost, exposed annual hours, automation operating cost, and implementation cost. The 2026 wage reference includes a median annual wage of $58,750 for machinists [S5].
Two wage-growth scenarios can be supported by the available evidence: 7.9% growth for machinists and a 15–25% wage premium for workers in highly automated facilities [S5][S2]. The spread matters because two projects with similar hardware costs can have different payback periods when technical labor and utilization assumptions differ.
Payback is strongest where annual avoided labor is measurable, operation hours are stable, and technical staffing can be shared across multiple cells. It is weaker where products change frequently, labor is only partly exposed to automation, or savings depend on unverified quality and safety estimates. This approach also connects the investment decision to manufacturing hiring in 2026, where manufacturers may need 3.8 million new workers through 2033 and approximately 1.9 million roles may remain unfilled [S4].
Signals for Tracking the Investment Case
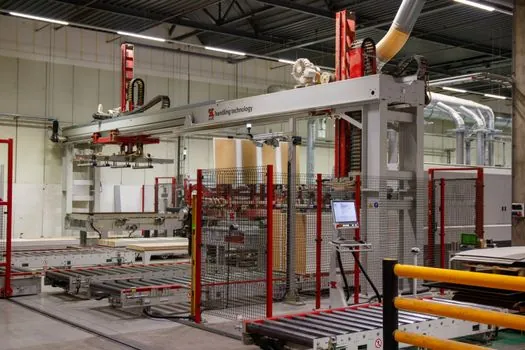
Track median wages for machinists, CNC programmers, and industrial machinery mechanics, then compare their wage growth with the 3.0% all-occupations benchmark and the 4% manufacturing stabilization rate [S5][S7].
Separately track project-level labor hours, cell utilization, changeover time, unplanned downtime, and technical hours per year. If wage benchmarks rise faster than automation productivity, the labor side of the payback case strengthens; if utilization or uptime falls short of the approved model, added technical labor can erase the expected savings [S1][S6].