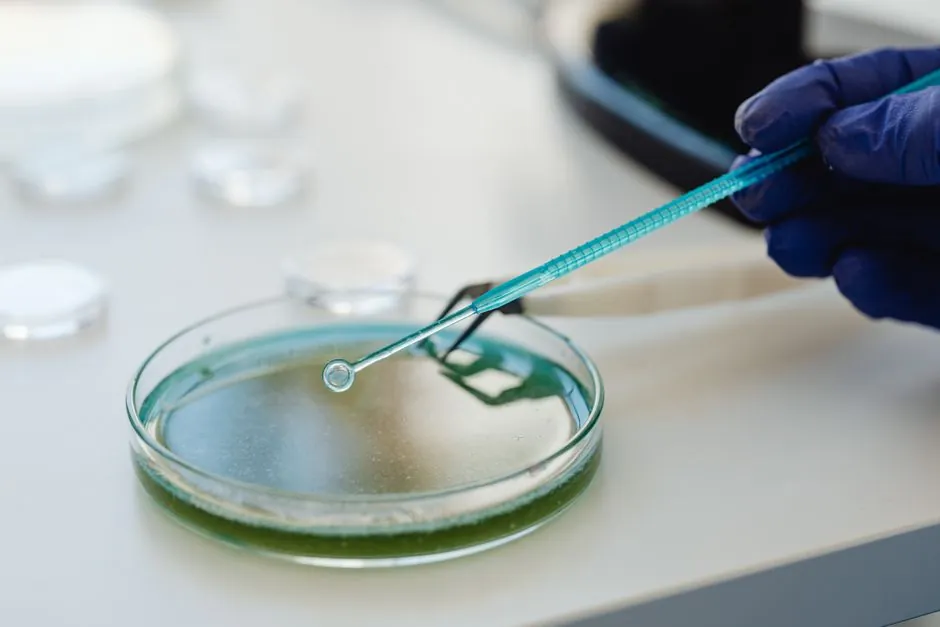
Particle size distribution (PSD), morphology, and flow rate are the three primary release-gate tests for metal powders used in laser powder bed fusion (PBF) and binder jetting, with PBF feed commonly specified in the 5-150 µm window per Malvern Panalytical application guidance [S5].
PSD controls layer thickness and energy input, morphology (especially sphericity) drives recoat uniformity, and flow rate gates hopper and coater behavior; the three are correlated but not substitutable, so qualification stacks typically run all three in parallel [S1][S3][S5].
Core Test Methods and What Each One Actually Returns
Laser diffraction is the workhorse for PSD on metal AM powders because it covers a 0.1-2000 µm range in a single measurement and resolves the d10/d50/d90 percentile cuts that downstream process engineers read against the powder datasheet, per Malvern Panalytical [S5] and HORIBA Scientific [S2]. The technique deduces size from scattering-angle vs intensity data using Mie or Fraunhofer optical models, which is why refractive index selection matters for non-absorbing metals like aluminum and copper [S5].
Dynamic image analysis and static automated microscopy complement laser diffraction by adding per-particle shape descriptors: circularity, convexity, elongation, and aspect ratio, with thousands of particles measured per run, per Microtrac application notes [S7][S10] and Malvern Panalytical [S5]. The Slotwinski et al. NIST round-robin on 17-4 PH stainless and Co-Cr powders ran both laser diffraction and X-ray computed tomography (XCT) for cross-validation, since each method samples different physical principles and they routinely disagree by 5-15% on d90 [S1].
Flow rate is most commonly reported via the Hall flow funnel per ASTM B213, with a 25 mm orifice as the default and a 10 mm orifice variant for fine or cohesive powders; results are expressed in seconds per 50 g, per the additive-manufacturing qualification playbook published on 2026-09-22 [S4]. For powders that fail to discharge through a Hall funnel, the Carney funnel (5 mm orifice) is the fallback, and the result is then paired with tap density per ASTM B527 to compute Hausner ratio and Carr index [S3].
Particle Size Distribution: The 5-150 µm PBF Window
Metal PBF feed stocks are usually specified across a 5-150 µm range, with sub-10 µm fines actively undesirable because higher surface-to-volume ratio raises interparticle friction and degrades flowability, while particles above 60 µm flow more easily but pack poorly and yield lower green density, per Malvern Panalytical [S5].
Practical specification cutoffs seen in the field: 316L and Ti-6Al-4V PBF powders are commonly released at d10 around 20-30 µm, d50 around 35-45 µm, and d90 below 75-90 µm, though binder jetting and directed energy deposition accept coarser distributions because layer thickness is 50-100 µm rather than 20-40 µm [S5]. Wide PSD improves packing through bimodal or trimodal blending, but it also shifts the laser energy density required for full melting, so a PSD change usually forces a build-parameter re-qualification [S3][S5].
Morphology: Sphericity, Satellite Content, and Internal Porosity
Sphericity above 0.90 (per image analysis) is the typical threshold for premium PBF powders, because spherical particles flow more consistently and form thinner, more uniform layers under the recoater; irregular particles create uneven layers that reduce laser coupling efficiency and produce lack-of-fusion defects, per Malvern Panalytical [S5] and the Slotwinski NIST study [S1].
Satellites (small particles fused to the surface of larger ones during gas atomization) are a recurring defect mode: they increase surface roughness, drag down Hall flow time, and entrap gas porosity, so sphericity is usually reported alongside a satellite count or surface-roughness descriptor rather than as a standalone number [S8]. For 3D shape data that image analysis cannot resolve, XCT delivers per-particle volume, surface area, and aspect ratio voxel-by-voxel, but it is throughput-limited to a few hundred particles per scan, per Zhou et al. (2021) [S9] and the NIST round-robin [S1].
Flow Rate, Tap Density, and the Limits of the Hall Funnel
The ASTM B213 Hall flow funnel returns a single number in seconds per 50 g; powders that bridge or stall fall back to the 5 mm Carney funnel, and when both fail the laboratory typically moves to a rotating drum, an automated Schulze ring shear tester, or the Granudrum avalanche-angle method, per Zegzulka et al. (2020) [S3].
Tap density per ASTM B527 paired with loose bulk density yields the Hausner ratio (tapped/loose), with values below 1.25 generally considered free-flowing and values above 1.4 indicating cohesive, hard-to-feed powder; Carr index runs the same comparison on a 0-100 scale [S3]. Zegzulka's data set shows flowability is not an inherent powder property: it shifts with humidity, stress history, and the specific equipment geometry, so a Hall flow number from a vendor datasheet is not directly portable to a different machine's hopper [S3].
Standardization Landscape and the Method-Comparison Problem
Current AM powder characterization draws on legacy PM standards, with laser diffraction mapped to ISO 13320, sieve analysis to ASTM B214, Hall flow to ASTM B213, tap density to ASTM B527, and apparent density to ASTM B212, though the AM community flags these as adapted rather than AM-native [S1][S3]. The Slotwinski NIST round-robin explicitly documents that laser diffraction, XCT, and SEM image analysis give different d50 values on the same powder, with deviations of several percent between methods, which is why qualification protocols usually mandate at least two independent techniques per critical parameter [S1].
Static image analysis platforms (e.g., Microtrac, Malvern Morphologi) can now combine PSD with shape descriptors in a single automated run, displacing manual microscopy and sieve stacks for lot-release work in aerospace qualification, per Microtrac's application note [S7] and Malvern's 2024 insight piece [S5].
Specification Selection by Process Route
Selection breaks down by AM process: laser PBF demands fine PSD (typical 15-63 µm), high sphericity (>0.9), and Hall flow under about 25 s/50 g, because the recoater must lay 20-40 µm layers without streaking [S4][S5]. Binder jetting tolerates coarser, less spherical powder because the binder, not the laser, fuses the part, so PSD windows commonly open to 75-100 µm and Hall flow can be relaxed or skipped entirely [S3].
For non-AM powder metallurgy, the same characterization suite still applies but with coarser PSD windows (often 45-150 µm for press-and-sinter) and tighter emphasis on apparent density and compressibility, per the MPI UK laboratory capability statement [S6]. Across all routes, the practical rule is: pick PSD and morphology tolerances that your atomizer can hold lot-to-lot, then write the test methods into the purchase specification so incoming QC and the powder supplier measure the same way [S1][S4].
Trackable signal to watch next: ASTM F42 and ISO/TC 261 committee work on AM-native PSD and flow standards, and the spread between static image analysis and laser diffraction d-values as a routine cross-check on incoming-lot release certificates. For an overview of how particle sizing fits into broader powder-handling specifications, the metal powder characterization primer collects the method-by-method breakdown, while dust particle meter instrumentation covers the related airborne-monitoring side of powder handling safety, and metal material ties the powder-property envelope back to bulk feed-stock grades.
For related coverage, see Laser Level Accuracy at 30 Meters: Spec, Tolerance, and Field Reality.