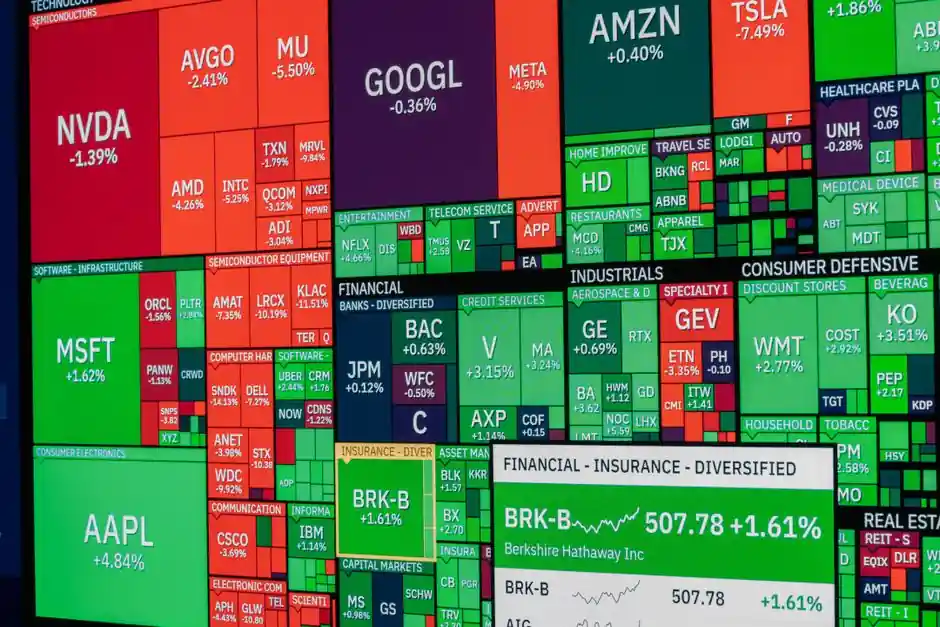
No defensible USD price for one 300mm NAND flash wafer was available in the supplied 2026 material, so procurement teams should not treat the widely circulated $20,000 figure as a NAND quote.
The relevant benchmark is NAND contract pricing: first-quarter 2026 prices were projected to rise 55%–60% quarter over quarter, while prime-wafer costs were pressuring module makers in August 2026 [S3][S4].
What the available 2026 NAND pricing data actually supports
The available analysis characterizes the 2026 NAND flash shortage as structural, driven by AI infrastructure and enterprise demand, and says it is likely to persist through 2027–2028. This percentage describes the change between contract periods, not the price of a single 300mm wafer and not a universal increase across every NAND specification.
A 2026 forecast projected a 10%–15% NAND flash price increase due to stronger enterprise demand amid a consumer-electronics slowdown. These two measures use different baselines, so they should not be added or treated as conflicting quotes. One describes a quarterly contract-price movement, while the other describes a forecast annual price increase.
Buyers should request a quotation by die density, TLC or QLC generation, grade, wafer condition, volume, and delivery term rather than ask for a generic “NAND wafer price.”
Prime wafers, downgraded materials, and specification risk
That substitution lowers input cost but introduces die-condition, performance, and yield questions that must be defined in the purchase specification.
A structured comparison separates three common purchasing paths. Prime 300mm NAND wafers offer the strongest supply and quality position but face the highest input cost; downgraded wafers can reduce material cost but require explicit acceptance criteria; finished modules and SSDs shift more assembly and inventory risk to the supplier rather than eliminating it.
The comparison below also separates four decision criteria:
Price alone is therefore a poor selection criterion. The comparable unit for internal analysis is cost per qualified GB at the module stage, not wafer purchase cost alone.
Capacity growth does not remove NAND-specific scarcity

Worldwide 300mm memory capacity was projected to reach 4.1 million wafers per month in 2026 and 4.2 million wafers per month in the following year. This expansion covers memory capacity rather than NAND alone, so the figures do not establish a NAND wafer output or price.
New 300mm lines also do not translate immediately into saleable NAND. Semiconductor capacity depends on process qualification, product mix, yield, wafer starts, conversion rates, and customer acceptance.
The available 2026 material identifies AI infrastructure and enterprise storage as demand drivers and says a single high-end AI GPU may require approximately 16TB of TLC or QLC NAND storage. These figures explain why enterprise-grade wafer demand can tighten while consumer markets remain soft.
More detailed 2026 NAND wafer capacity and monthly supply outlook is useful for separating total 300mm expansion from NAND-specific allocation, but neither dataset provides a defensible 2026 NAND price per 300mm wafer.
Why the $20,000 wafer figure is not a NAND benchmark
N3 is an advanced logic process, whereas NAND flash is a different product class with different bit densities, die architectures, conversion requirements, and supply conditions.
The comparison is therefore invalid as a direct NAND price reference. A $20,000 N3 foundry wafer may carry many logic dies at an advanced node; a NAND wafer contains flash dies organized to maximize storage density, with prices varying by capacity, layer count, TLC or QLC type, grade, and contract volume.
The die-per-wafer method estimates gross dies from a wafer while accounting for unusable edge areas and spaces between dies such as scribe lines. Edge loss, scribe lanes, test structures, wafer margins, process rules, and final die count vary by producer and process, so the final gross-die figure must come from the supplier [S5].
Cost drivers behind the 2026 NAND wafer price
The first cost driver is supply discipline and product allocation. Tighter allocation limits how much output reaches general-purpose buyers.
The second driver is yield and usable output. A 300mm wafer is priced on qualified die output, not theoretical geometric area. Scribe lines, edge exclusions, process test structures, defective dies, and conversion losses all raise the effective cost per usable GB. The estimate of roughly 670 gross dies illustrates why die dimensions materially affect wafer economics, but it cannot substitute for a NAND-specific die-per-wafer calculation [S5].
The third driver is material quality. Prime wafers carry higher input cost, while downgraded material can reduce acquisition cost for secondary channels [S3]. The fourth driver is order scale and delivery term: a high-volume contract can improve pricing and supply priority, while small, expedited orders face less favorable allocation.
The fifth driver is conversion and inventory. Buyers that lack conversion capacity face module or SSD prices rather than raw-wafer economics. For those buyers, assembly, test, packaging, inventory carrying, scrap, and qualification costs can outweigh the apparent saving from selecting downgraded wafers.
Total cost of ownership and procurement method
The lowest wafer quote is not necessarily the lowest delivered memory cost. A complete total-cost comparison should include the wafer purchase price, incoming inspection, test coverage, conversion loss, assembly, packaging, module testing, write performance, power draw, warranty replacement, and expected field returns. [S3]
Prime material can reduce conversion and field-failure risk when those costs are included, while downgraded material may improve economics only if the application tolerates its yield and performance limits [S3]. Enterprise SSD qualification is materially stricter than resale into a secondary market because the end use may require consistent endurance, latency, power behavior, and firmware support.
A defensible procurement request should specify 300mm format, NAND type, TLC or QLC, die density, layer generation, acceptable grade, target bits per wafer, test requirements, monthly volume, contract duration, delivery schedule, and warranty treatment. For long-term supply, ask for quarterly volume allocation, price-adjustment terms, and notice periods for process or material changes.
The most useful comparison points are the August 2026 spot description of high prime-wafer prices and mostly stable specifications [S3], plus the separate 55%–60% first-quarter contract-price movement and 10%–15% broader increase forecast [S4][S6]. A supplier quotation tied to those specifications can convert the market indicators into a purchase price.
Constraints, failure modes, and trackable signals

The principal failure mode is applying a foundry-wafer price to NAND, because process type, die architecture, output, and supply constraints differ. The second is extrapolating a contract-price percentage into a per-wafer quotation without a density and grade. The third is treating a prime-wafer premium as waste, since failed conversions and warranty failures can erase the purchase-price advantage. [S4]
Four signals are trackable in 2026-2027 procurement records: monthly NAND wafer spot and contract movements, selected high-capacity specification adjustments, module-maker demand for downgraded material, and the conversion of 300mm capacity additions into qualified NAND output [S1][S3]. The capacity path from 4.1 million to 4.2 million wafers per month is useful, but it covers memory as a broader category rather than NAND alone [S1].
For a budget model, use supplier-specific prices for each qualified density and grade, then add conversion, test, assembly, inventory, and failure costs. Use the published 55%–60% and 10%–15% movements as scenario context, not as arithmetic inputs to a per-300mm NAND price that the supplied research does not disclose [S4][S6].