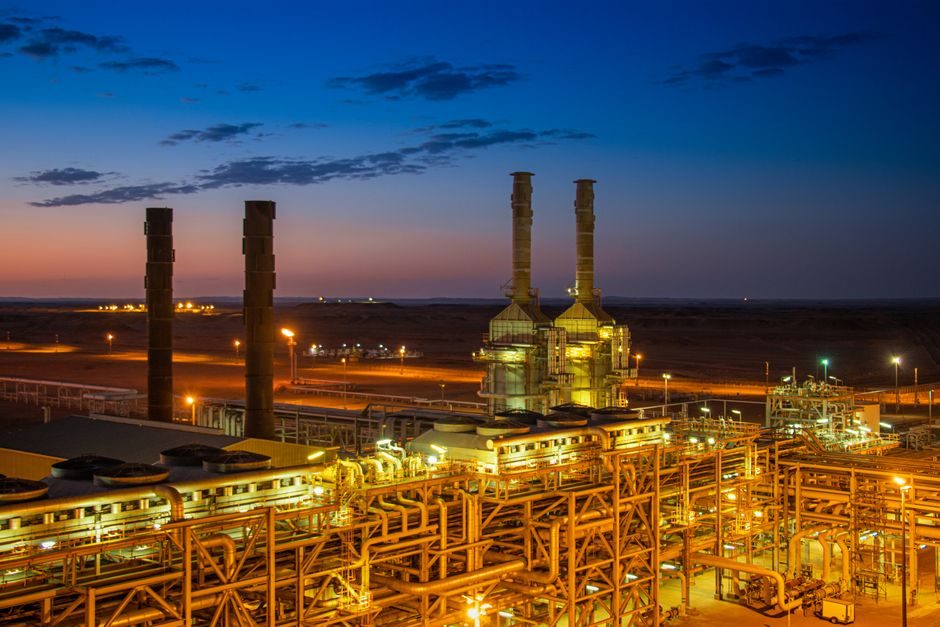
China's March 2025 commissioning of the world's largest single-site olefin complex adds a multi-million-tonne ethylene and derivatives layer to a national capacity base that already ranks first by output, reshaping Asia-Pacific supply math through 2026 [S3].
Globally, olefins and aromatics remain the headline capacity proxies; for sourcing engineers, the practical readout is country-level ethylene complex counts, paraxylene/MEG/PVC line counts, and the 2022 baseline product splits (e.g. Colombia at sub-megatonne per product category) that frame the long tail [S2].
Side-by-side with adjacent energy-materials build, the LNG Global Production Capacity by Country: 2025 Operating Mix and 2026-2028 Build Tracks map shows the same Gulf and U.S. hubs feeding both fuel and feedstock slates, and the Lithium Battery Global Production Capacity: 2025-2026 Country Rankings and article shows the parallel East-Asian chemicals-to-battery chain consolidation.
Country-Level Capacity Map: Where the Tonnage Actually Sits
Capacity reporting for petrochemicals clusters on ethylene, propylene, butadiene, benzene-toluene-xylene (BTX), polyethylene (LDPE/HDPE/LLDPE), polypropylene, PVC, styrene, methanol, ethylene oxide/ethylene glycol, acrylonitrile and paraxylene. The single biggest swing factor in 2026 readings is Chinese single-site olefin scale: a 2025 startup positioned as the world's largest single-site olefin plant, with downstream polyethylene, polypropylene and ethylene-oxide/EG units sized to absorb its ethylene/propylene output, materially extends China's lead in ethylene-equivalent capacity [S3]. Saudi Arabia, the United States, South Korea, India, Iran, Japan, Germany and the Netherlands follow in roughly that order when measured on ethylene complex count and downstream integration; GCC operators report an 8% per-ton energy-intensity reduction over a two-year window through technical renovations — useful context for buyers benchmarking Scope-1+2 intensity, not output [S1].
For long-tail national reads, the Statista 2022 Colombia series shows petrochemical capacity reported per product in 1,000 t/y increments — typically a sub-megatonne figure for categories like polyethylene, polypropylene and PVC, well under one-tenth of a major Asian complex line, which is the realistic floor a sourcing engineer should plan against when qualifying a Latin-American second source [S2].
Selection Criteria: How to Read a Country's Petrochemical Supply Position
Four decision variables dominate a buyer's country shortlist: (1) ethylene-cracker size and steam-cracker count, because they set the derivative pyramid; (2) downstream integration depth (PE, PP, PVC, EO/EG, styrene, paraxylene on the same site or cluster) — fewer transport legs mean tighter lead-times; (3) feedstock flexibility — ethane vs. naphtha vs. coal/MTO changes unit cost more than any single efficiency retro; and (4) energy intensity, where the documented GCC 8% per-ton energy reduction over two years sets a measurable benchmark for plant-level claims [S1].
A five-axis comparison a sourcing team can paste into a qualification matrix:
Axis 1 — Cracker scale: China (mega single-site) > USA (multiple world-scale Gulf Coast crackers) > Saudi Arabia (integrated Jubail/Yanbu) > South Korea (Ulsan/Yeosu) > India (Dahej, Jamnagar) [S3].
Axis 2 — Feedstock: USA = ethane (shale), GCC = ethane/butane, South Korea/India/Japan = naphtha, China = mixed (naphtha + coal-to-olefins / MTO) [S3].
Axis 3 — Derivative depth: Saudi > China > USA > South Korea for PE/PP/EG on one site [S1][S3].
Axis 4 — Energy intensity: GCC 8% per-ton reduction over two years (2014 window) is the only quantified figure on record in this feed — treat other countries as un-quantified [S1].
Axis 5 — Per-category capacity floor: small Latin-American producers sit at sub-megatonne per product category, useful only for regional or specialty fills [S2].
Who the Build Is For, and Who It Is Not
The 2026 wave of large-scale Chinese and GCC capacity is built for buyers who can absorb full-polymer-train contracts of 100,000+ t/y per grade, who can plan on multi-month voyage windows, and who need standardized prime grades (HDPE film/injection, LLDPE, homo-PP, MEG fiber-grade, PVC K67-K68). Those buyers — film converters, bottle and container producers, polyester fiber mills, PVC pipe and profile extruders — get the most cost leverage from this capacity tier [S3].
It is a poor fit for buyers needing small-lot, narrow-MFR specialty PP, engineering-grade polymers, medical-grade PVC, or tight JIT deliveries into land-locked regions; the same large complexes optimise for marine-grade bulk, not for sub-500 t spot lots. For those requirements, second-tier Asian, Eastern-European, and Latin-American producers — typified by the sub-megatonne per-category footprint recorded for Colombia in 2022 — remain the relevant pool [S2].
Limitations, Failure Modes, and Sourcing Watch-Outs
Capacity headlines overstate what a plant can actually deliver. Three failure modes recur: (1) planned vs. nameplate gap — Chinese single-site mega-complexes are typically commissioned in phased trains, with full nameplate often running 12–24 months behind first ethylene; the March 2025 startup is the trigger, not the steady-state [S3]. (2) Feedstock-driven grade variability — naphtha crackers make a wider alpha-olefin slate than ethane crackers, so a Chinese or Korean cracker cannot be substituted spec-for-spec for a U.S. ethane LLDPE on certain film grades without re-qualification. (3) Logistics asymmetry — Gulf and U.S. Gulf Coast export tonnage moves on long-haul VLGC/VLOC parcel sizes; smaller buyers get resold split parcels, which is where the per-ton delta shows up.
A practical control: ask each shortlisted supplier for (a) nameplate vs. demonstrated 12-month run rate, (b) feedstock declared on the certificate of analysis, and (c) the last two quarterly operating rates. GCC operators reporting an 8% energy-intensity reduction over two years is a usable proxy only for energy-management maturity, not for absolute reliability [S1].
Standards, Verification, and Process-Engineer Notes
Country-level capacity is a commercial dataset; product-level acceptance is governed by industry standards. For polyolefins the relevant specifications are issued by ASTM (e.g. D4976 for PE, D4101 for PP), ISO equivalents (ISO 1872-1, ISO 19069-1), and — for pipe-grade — by API, AWWA and EN pipe standards that dictate resin MRS classification. For PVC, EN 1452 and ASTM D1784 cell-class limits drive grade selection. For process-side compatibility — the moment a petrochemical tonnage decision lands on a specifier's desk — the upstream pressure transmitter and flow meter loops on the storage and dosing skid still need to be re-validated, since a feedstock shift (e.g. coal-to-olefins vs. naphtha) can change trace impurity profiles that affect instrument wetted-parts material selection. [S1]
Quotable benchmark from the research: "Gulf Cooperation Council (GCC) chemical and petrochemical producers have reduced energy consumption per ton by 8% over the last two years" [S1]. The figure is dated (2014 vintage) and is the only quantified energy-intensity claim in the feed; do not extrapolate it to 2026 without independent verification.
Sourcing Cues for the 2026 Buying Window
Track three signals through the rest of 2026. First, the ramp curve on the Chinese mega single-site olefin complex post-March 2025 — each additional 100,000 t/y of derivative train coming online shifts Asia-Pacific spot parity [S3]. Second, feedstock-basket price spread between U.S. ethane, Middle East ethane/butane, and Asian naphtha — at the 2026-07-10 read, Henry Hub Natural Gas Holds 3.28 USD/MMBtu Into July 2026 Heat Window, which is the input cost that anchors U.S. ethane cracker economics and, by extension, U.S. export PE/PP price formation. Third, GCC energy-intensity disclosures — the 8% figure is the floor; further retrofits will be the next benchmark number published in plant ESG reports [S1].
Cross-check: the MEMS Sensor Global Production Capacity by Country: SEMI 25% Build-Out, China Fab Density article is adjacent only in country-build narrative and is not a petrochemical input.
For component-level specifications, see industrial valve.