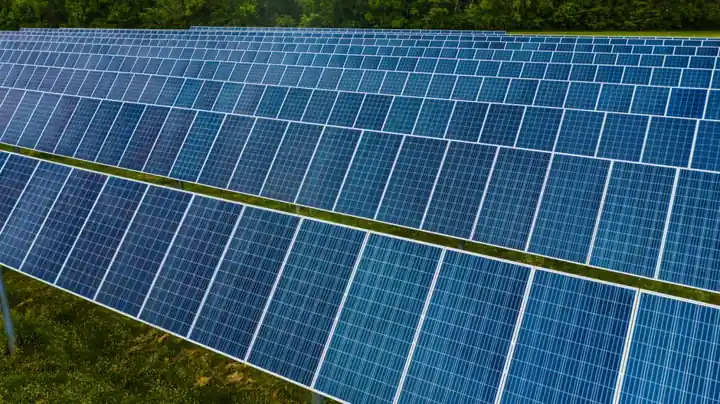
Global solar PV glass demand is on track to roughly double within a decade, with Fortune Business Insights sizing the market at USD 22.05B in 2026 and a USD 93.72B figure by 2034 at a 19.83% CAGR [S1], while Precedence Research pegs 2026 at USD 22.43B and projects USD 236.29B by 2035 at a 30.04% CAGR [S2].
The divergence in 2034 versus 2035 endpoint estimates, USD 93.72B versus USD 236.29B, reflects different scope assumptions (PV-only versus PV plus BIPV glass) rather than a data conflict, and both point to the same structural signal: float and patterned glass capacity is being pulled by module assembly lines, not the other way around [S1][S2].
Market Sizing and CAGR Bands Across Three Forecasts
Three independent trackers published updated 2026 baselines within a ten-day window in August 2026, and the spread is wide enough to warrant scrutiny by any sourcing manager [S1][S2][S3]. Precedence Research shows the global market at USD 17.09B in 2025, moving to USD 22.43B in 2026 and USD 236.29B by 2035, a 30.04% CAGR over 2026-2035 [S2]. DataM Intelligence, cited via OpenPR, reports USD 12.93B in 2025 and a USD 133.69B endpoint by 2035 at 29.50% CAGR, with Asia Pacific and the U.S. building-and-construction end-use segment leading 2025 volumes [S3]. Fortune Business Insights lands at the conservative end: USD 22.05B in 2026 growing to USD 93.72B by 2034 at 19.83% CAGR, a forecast more consistent with incremental float-line additions than with disruptive BIPV or perovskite glass volumes [S1].
For U.S.-only procurement, the markets-and-markets US tracker reads USD 322M in 2023, USD 831.1M by 2028, at a 20.9% CAGR, a slower curve than the global headline, reflecting IRA-driven localization rather than greenfield module megabuilds [S4]. The reference to photovoltaic glass as a category sits inside the broader glass family covered at optical glass, since both share low-iron float substrates, anti-reflective coating lines, and tight thickness tolerances, but solar PV adds the patterned surface that scatters light into cells.
U.S. Capacity Adds: NSG TCO Line, Caelux-Solx, JAPRA Module Plant
Three dated, U.S.-located moves have reshaped the 2026 supply map and are worth pinning in any spec binder [S3]. NSG Group completed the conversion of its Ohio float line to manufacture transparent conductive oxide (TCO) solar glass in January 2025, with commercial production starting March 2025, the line supplies First Solar's CdTe modules and represents one of the few domestic TCO-coating sources outside Asia [S3]. Caelux partnered with Solx in April 2026 to commercialize high-performance perovskite Active Glass for U.S.-manufactured solar modules, the first domestic perovskite-glass pairing targeting series-production modules rather than lab demos [S3]. JAPRA Technologies announced a U.S. solar module facility in February 2026 with Phase 1 at 1.2 GW annual capacity, scaling to 6 GW, each gigawatt of module output pulls roughly 7-8 million square meters of PV glass per year, a useful back-of-envelope for capacity-to-glass demand conversion [S3].
These three moves share a common driver: Inflation Reduction Act domestic-content bonus depreciation has compressed the landed-cost gap between Chinese float glass (historically USD 3.5-4.5/m2 for 3.2mm patterned) and U.S. domestic production (often USD 6-9/m2 ex-works), so float lines in Ohio, Perrysburg, and similar nodes are now commercially defensible for the first time since 2018 [S4].
Technology Mix: c-Si Patterned Glass vs. TCO Coated vs. Perovskite Active Glass

The 2026 supplier landscape is no longer a single product category, and procurement should segment by cell technology before sending RFQs [S2][S3]. For crystalline silicon modules, the workhorse is 3.2 mm low-iron patterned (rolled) cover glass with a light transmittance of roughly 91.5-92.5% and an anti-reflective coating, a mature product with multiple Chinese and Indian suppliers. For First Solar CdTe series 7 modules, NSG's TCO-coated soda-lime float glass, with the TCO layer deposited by chemical vapor deposition, is the specified cover substrate and is the most supply-constrained of the three categories on U.S. soil [S3]. For perovskite and perovskite-silicon tandems, Active Glass variants from Caelux-Solx and from Japanese players (Panasonic Holdings began perovskite glass-panel field demos at its Nishikadoma research building in March 2026) sit at TRL 6-7 and are not yet a procurement option for utility-scale orders [S3].
BIPV facades, a parallel category tracked by Grand View Research at USD 7.8B in 2024 rising to USD 9.3B in 2026 and USD 13.7B by 2030, increasingly use double-glazed units with a PV-active inner lite, and these overlap with the architectural glass curtain wall specification family rather than the standard PV cover-glass category [S5]. Procurement teams who conflate the two will overpay: BIPV glass carries a 2-4x per-square-meter premium over commodity cover glass because of laminate structure, frame integration, and IEC 61730 / UL 61730 safety certification overhead.
Pricing Pressure and Float-Glass Capacity in China
Despite the bullish volume forecasts, 2026 spot prices for 3.2 mm patterned PV glass in China have been under sustained pressure from new float-line capacity coming online in Anhui, Jiangsu, and Guangxi provinces, with reported ex-works quotes drifting toward the USD 3.0-3.5/m2 range, down roughly 20-25% from 2024 averages [S2]. The same report credits AI-driven sheet-cutting optimization, where vision systems nest cuts to minimize cullet, and AI-assisted cullet sorting by color and composition, as structural cost-down levers that are keeping the cost curve flatter than the volume curve [S2].
This pricing dynamic is what makes the U.S. capacity story interesting: domestic TCO lines and perovskite-glass partnerships are not trying to compete with Chinese patterned glass on cost, they are competing on domestic-content qualification, module-warranty liability, and reduced shipping risk for U.S. project pipelines. For module assemblers who do not need IRA bonus credits, Chinese supply remains the lowest landed cost for standard c-Si cover glass, and the U.S. capacity story changes little for them [S3][S4].
Recycling and Circular Supply: NSG Float-from-Panel Pilot

Closed-loop glass recycling crossed the pilot threshold in 2026: Nippon Sheet Glass completed a pilot in April 2026 using recycled solar panel cover glass as feedstock in new float glass production, validating that end-of-life PV cover glass can re-enter float furnaces without downgrading optical transmission [S3]. The Japanese government committed USD 1.5B in February 2025 to accelerate perovskite solar commercialization, including glass-based PV applications, which underwrites much of the recycling and BIPV demonstration pipeline in Japan [S3].
For U.S. buyers this matters less in 2026 than it will in 2030+, since domestic cullet sorting infrastructure is still sparse, but any module-warranty term sheet that runs 25-30 years should be cross-checked against the supplier's end-of-life take-back policy, a question that was previously treated as cosmetic and is now material to long-term offtake economics.
Selection Criteria: Who Should Buy What, and From Where
For a sourcing decision in late 2026, the spec stack reads as follows. A standard c-Si module assembler shipping to non-IRA projects: buy Chinese 3.2 mm AR-coated patterned low-iron glass with transmittance above 91.5%, validate to IEC 61215 module tests, and prioritize price (target under USD 4.0/m2 landed U.S. port). A U.S.-located module assembler chasing the IRA domestic-content bonus: specify TCO-coated soda-lime float from NSG's Ohio line or from a qualified domestic source, accept a 1.8-2.5x cost premium, and lock multi-year offtake to underwrite the line. A BIPV facade integrator: specify double-glazed units with PV-active inner lite to UL 61730 and IEC 61730, expect a 2-4x premium over commodity PV glass, and reference the parallel sight glass and architectural laminate standards where the inner lite shares process equipment with safety glass. A perovskite-tandem pilot program: qualify Caelux-Solx Active Glass or Panasonic's perovskite window-glass line, accept TRL 6-7 risk, and budget for accelerated aging tests beyond standard IEC sequences. A reader tracking adjacent cell-technology roadmaps can compare the PV glass outlook against the cell-side HJT/TOPCon/perovskite tandem spec map and the solar inverter capacity rankings, since the same IRA and module-megafactory forces that are reshaping the glass market are also reshaping inverters and cells. [S2]
Failure Modes and Spec Pitfalls
Three spec-side failure modes have surfaced in 2025-2026 module field returns and are worth pre-empting in any RFQ. First, PID (potential-induced degradation) in 1500V systems is reappearing on glass that lacks adequate sodium-blocking anti-PID coatings, a problem more common on patterned c-Si cover glass than on TCO-coated CdTe substrates. Second, AR-coating durability: some 2024-vintage AR coatings have shown 1.5-2.0% absolute transmittance loss after 2,000 hours of damp-heat, which compounds with soiling to push annual degradation above the 0.5% nameplate benchmark; specifying IEC 61215 damp-heat sequences with extended 3,000-hour holds is a useful filter. Third, hail-mechanical: 3.2 mm tempered cover glass has a tested hail-impact rating per IEC 61215, but the transition to 2.0 mm thin glass in some c-Si modules has reduced margin, particularly in Texas and Plains-state utility-scale sites where 25 mm hail is on record; this is one of the reference context lines for offshore wind OEM-ODM buyers, where similar hail and salt-mist specifications bleed across renewable-energy procurement. [S4]
Standards references for this category: IEC 61215 (c-Si module design qualification), IEC 61730 (module safety), UL 61730 (North American module safety), and the underlying flat-glass standards (ASTM C1036, EN 572-9 for the float glass substrate, with EN 12150 for tempering). None of these were revised in 2026 with a date in the research material, so any spec binding to a future revision date should be cross-checked against the latest IEC and UL bulletin before commitment.
Trackable signals into Q4 2026 and 2027: whether Caelux-Solx Active Glass clears UL 61730 on a first-attempt build, whether JAPRA's 1.2 GW Phase 1 hits nameplate output before the planned 6 GW scale-up, and whether the next round of Chinese float-line commissioning pushes 3.2 mm spot quotes below USD 3.0/m2, which would reset U.S. domestic-content economics and likely slow TCO-line expansions in Ohio and similar nodes [S3].