Huawei, SMA Solar Technology, SolarEdge, Enphase, and Fronius remain the headline brands in the 2026 solar inverter market, with the global market sized at USD 22.81–22.82 billion for 2026 and forecast to reach USD 39.54–39.56 billion by 2034 at a 7.12% CAGR [S3][S4]. A parallel analyst estimate puts the market at USD 15.24 billion in 2026 rising to USD 21.16 billion, illustrating how methodology differences between shipped-revenue and installed-value models still split the headline number by roughly USD 7 billion [S8].
The 2026 vendor field splits cleanly along topology and grid-intelligence lines: string inverters anchor the volume tier, microinverters and module-level electronics take the residential premium tier, and central inverters remain dominant in utility-scale projects, with on-grid systems holding 74.30% of the 2025 connection-type mix [S4]. Asia-Pacific captured 57.6% of 2025 market share, while Europe is tracking a 5.97% CAGR through the forecast window and the US market alone is valued at USD 3.29 billion for 2026 [S4].
2026 Market Sizing: Three Analyst Cuts, One Direction
Market Research Future sizes the global solar inverter market at USD 14.35 billion in 2024, USD 15.16 billion in 2025, and USD 26.4 billion by 2035, implying a 5.7% CAGR across 2025–2035 [S2]. Fortune Business Insights projects a faster USD 22.81 billion in 2026 to USD 39.54 billion by 2034 at a 7.12% CAGR [S3], and Straits Research matches that 7.12% figure while giving a USD 22.82 billion 2026 base and USD 39.56 billion 2034 endpoint [S4].
Mordor Intelligence lands closer to MRF on absolute dollars, putting the market at USD 14.27 billion in 2025, USD 15.24 billion in 2026, and USD 21.16 billion at the end of the forecast [S8]. The MRF/Mordor cluster is consistently below the Fortune/Straits cluster by 30–50% across overlapping years, a gap that mostly tracks whether service, monitoring, and balance-of-system revenue are bundled into the inverter line item.
Vendor Map: Who Sells What, and Where They Sit
The 2026 short list, drawn from multiple 2026 vendor rankings, is anchored by Huawei, SMA Solar Technology, SolarEdge, Enphase, and Fronius, with TMEIC, ABB, Schneider Electric, and Victron Energy rounding out the regularly cited field [S2][S7]. Wood Mackenzie's June 2026 Global Solar Inverter Market Share Report ranks manufacturers by 2025 shipped capacity, the de-facto reference for utility-scale and C&I procurement teams sizing their 2026 supplier panels [S1].
Geography divides the field sharply: Huawei, Sungrow, and Ginlong (Solis) hold the bulk of Asia-Pacific and utility-scale share; SMA and Fronius anchor Europe; SolarEdge and Enphase own the US residential and small-commercial segment with module-level power electronics. India is served by a hybrid stack of Western, Chinese, and domestic brands, with the 2026 Indian top-10 list explicitly including Chinese and European alternatives alongside local names [S7]. Among utilities, VFD-driven plant-side controls, PLC-based flow-meter telemetry, and pressure-transmitter feeds now interface directly with smart-inverter gateways, which is why the inverter-vendor stack matters to instrument engineers as well as to PV integrators.
Product Architecture: String, Micro, Central, and Hybrid
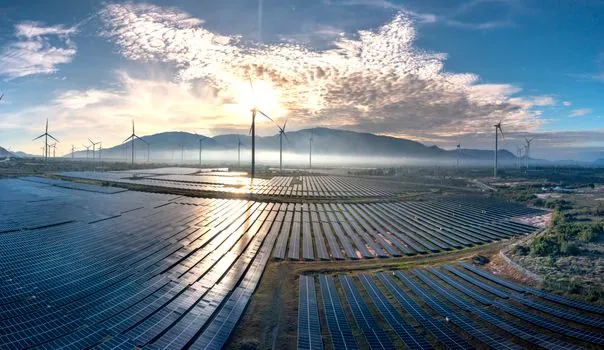
String inverters remain the volume backbone of the 2026 market and are projected to grow at 9.80% CAGR through the forecast window, the fastest of any type segment [S4]. Microinverters and module-level power electronics (MLPE) keep the residential premium tier, where shade tolerance, panel-level monitoring, and rapid-shutdown compliance justify the per-watt premium. Central inverters stay dominant in utility-scale plants above roughly 5 MW, where footprint, O&M cost per MW, and DC-string aggregation economics still beat distributed architectures.
Hybrid inverters, which bundle PV MPPT with a battery bidirectional stage, are the fastest-growing topology outside of pure string, and tie directly into the residential and small-commercial storage boom. Three-phase string inverters now routinely ship with grid-forming firmware, meaning they can synthesize a voltage reference on islanding rather than just following the grid, a capability that was exclusive to central utility inverters five years ago. Single-phase units still grow but at a slower 3.43% CAGR through 2034 [S4].
Spec Lines That Now Differentiate the Stack
Conversion efficiency alone no longer separates vendors: European efficiency numbers in the 97.5–98.6% band are table stakes, and the 2026 differentiation lives in three adjacent layers. First, the semiconductor stage has shifted decisively to silicon carbide (SiC) and gallium nitride (GaN) switches, which lift switching frequencies, cut magnetics mass, and push CEC-weighted efficiency above 98% in premium string products [S4]. Second, MPPT count and granularity: 6 to 12 independent MPPTs in a 50–100 kW three-phase string unit is now common, versus 2 MPPTs as the 2020 baseline.
Third, the software and communications stack, where AI-enabled smart inverters now run edge ML for fault detection, arc-fault mitigation, and grid-support functions such as Volt-Var and Volt-Watt, per the same 2026 market reading [S4]. PatSnap's 80-record patent analysis covering 2009–2026 documents this shift as a distinct Advanced Intelligence Phase (2023–2026), with 15–18 filings in three years and South Korea alone contributing 65–70% of the dataset [S5]. A 2026 cluster of filings covers digital-twin failure prediction, AI/ML fault diagnostics, bidirectional on-off-grid UPS control, and multi-MPP candidate analysis, all signalling that the value-creation locus has moved from silicon to firmware [S5]. Related procurement work, such as hydraulic component sourcing, shows the same firmware-versus-metal pattern repeating across other industrial equipment categories.
Decision Criteria: How Buyers Are Scoring Vendors in 2026

Procurement teams in 2026 are scoring solar inverter vendors against five concrete criteria rather than chasing a single headline efficiency number. Weighted equally in most utility-scale RFPs, those criteria are: (1) shipped capacity and bankability track record, (2) European or CEC-weighted efficiency at the operating MPPT loading point, (3) grid-support function coverage (Volt-Var, Volt-Watt, frequency-watt, ride-through, and grid-forming), (4) service network density and mean-time-to-replace, and (5) cybersecurity and communication protocol support, typically Modbus TCP, Sunspec, and IEEE 2030.5. [S1]
For residential and small-commercial buyers, the comparison pivots: warranty length (10-year standard, 12- and 25-year options), module-level monitoring cost, and battery-inverter compatibility now outweigh peak efficiency by a wide margin. The same logic shows up in natural-gas process control, where instrumentation buyers weigh protocol support and service life more than headline accuracy. For utility-scale, the comparison is essentially: Huawei and Sungrow on cost-per-W and bankability; SMA and Power Electronics on grid-forming pedigree; TMEIC and ABB on legacy utility comfort.
Regional Outlook and Constraints
Asia-Pacific's 57.6% 2025 share is the structural anchor of the global market, and within that, China-based module and inverter capacity means that domestic price formation effectively sets the global floor for string-inverter ASPs [S4]. Europe is the second-largest regional block and is growing at a 5.97% CAGR, with regulatory pressure on grid-forming capability and cyber-secure communications shaping 2026 product launches [S4]. The US recovery from a 2023 ASP trough to a USD 2,500-equivalent ASP by 2026 reflects regained pricing power as inventory destocked and IRA-driven utility-scale demand returned, a phase shift that has favoured module-level electronics vendors [S6].
Three constraints are real and material: tariff and trade-policy uncertainty on Chinese imports into the US and India, the pace of grid-forming certification against IEEE 2800 and IEC 62910, and the silicon-carbide supply chain, where Wolfspeed, II-VI/Coherent, and several Chinese suppliers are running near full utilisation. Each of these can swing vendor market share by 200–500 basis points over a 12-month window, which is why the 2026 vendor ranking is more volatile than the headline market size suggests [S1][S5].
Signals to Track in Late 2026 and Into 2027
Three trackable signals will move the 2026 vendor ranking before Wood Mackenzie's next capacity update. First, the IEEE 2800-2022 conformance wave for inverter-based resources, with most US ISOs now requiring grid-forming ride-through by 2027, which favours vendors with deep GE-Energy, SMA, and ABB heritage. Second, the price spread between SiC-based and IGBT-based string inverters, which has compressed from roughly 25% in 2023 to a projected 8–12% by end-2026 and is collapsing the efficiency-based differentiation. Third, the rollout of VPP-aggregation protocols and the IEEE 2030.5 / IEC 61850 gateway split, which together determine whether residential microinverter vendors can participate in utility dispatch or get cut out of the revenue stack.</h2> <p>PatSnap's 15–18 advanced-intelligence filings from 2024–2026 imply that the next 12 months will see at least 5–8 more patents published on digital-twin inverter models and AI-driven fault diagnostics, and South Korea's 65–70% share of the analysed dataset suggests that the patent race is not just a US–China story [S5]. The 2026 competitive landscape is, in practice, a firmware race run on shared SiC/GaN hardware, and the vendors that ship the most useful grid-support feature set in 2026 will lock in the 2027 utility-scale order book.