
NIST calibrates turbine meters using its volumetric 20-L piston prover with a 1.2 cSt (20 °C) PG+W mixture.
The calibration covers a specific meter, fluid viscosity range, and temperature; for liquids, kinematic viscosity in cSt or mm²/s must be paired with measured frequency and volumetric flow [S1][S4].
What the universal viscosity curve actually represents
The universal viscosity curve, commonly called UVC, is a calibration relationship used to account for the turbine meter’s response to changing liquid viscosity [S1][S2]. A turbine rotor advances at a frequency related to volumetric flow because each blade passage corresponds to a fixed displaced volume, and the calibration records the meter factor for known flow rates [S1].
For turbine meters, the practical K-factor is often defined as frequency divided by flow, in pulses per litre [S5]. A UVC is constructed from calibration runs at several viscosities within the meter’s operating viscosity range. The plotted variables are selected to compare the calibration results across fluids without mixing geometry-dependent or bearing-dependent behavior [S4].
Why a fixed Hz-per-cSt scale is invalid
Frequency is an output of rotor speed, not a direct unit of viscosity, so a meter does not have an intrinsic Hz-per-cSt coefficient [S5]. For the same frequency, different fluids can produce different volumetric flow rates because bearing drag, viscous drag, rotor geometry, and operating flow regime affect rotor response [S2][S4].
The 2,000 threshold therefore supports Reynolds-based analysis, not a universal Hz-per-cSt substitution.
A laboratory that tests a meter over 25, 40, and 50 mm diameters at 7 cSt, 17 cSt, and 34 cSt demonstrates that viscosity correction is part of meter characterization rather than a constant property of the turbine technology [S6]. Flow-computer functions can correct a frequency output using temperature-derived kinematic viscosity and a dimensionless calibration graph, but the correction still depends on the selected meter curve [S5].
Building the calibration data correctly
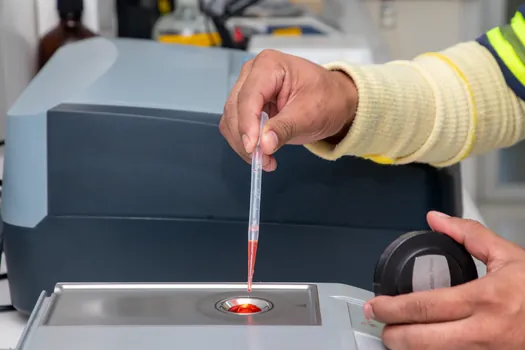
Use a traceable volumetric prover to establish known flow through the meter while recording the simultaneous frequency output. NIST uses a 20-L piston prover with a 1.2 cSt PG+W mixture at 20 °C; the prover has a stated 95% confidence uncertainty of 0.074% [S1]. Each pair of measured frequency and prover flow defines a point on the meter’s calibration curve [S1].
Run enough points to map both the low-flow nonlinear region and the operating range. The calibration must include the fluid and temperature conditions because liquid viscosity changes with temperature, and a K-factor curve can change in both shape and vertical offset [S5]. As a practical illustration, ISO 32 mineral oil has a kinematic viscosity of 32 cSt at 40 °C but more than 80 cSt at 20 °C [S5].
Plot the results using the manufacturer’s or laboratory’s agreed dimensionless variables, including Reynolds number and the relevant meter-factor or flow-frequency relationship [S4]. A UVC based on K versus the flow-frequency term divided by kinematic viscosity is one published convention [S7], but the implementation must match the meter geometry and calibrated variables rather than reuse another meter’s coefficients [S2][S4].
Comparison of correction approaches
A fixed Hz-per-cSt factor is the cheapest calculation, but it is technically weak because it cannot represent a nonlinear K-factor curve or separate viscosity-independent flow from bearing-dependent drag [S1][S5]. It is suitable only when a manufacturer has explicitly validated that approximation over the complete fluid, temperature, and flow range.
A multi-point K-factor-versus-flow curve supports the linear portion of turbine operation and can extend usable turndown. A 15-point curve has been described as providing 1% accuracy of indicated reading across a 100:1 turndown ratio, from 4 to 400 L/min, under its stated conditions [S5].
A UVC or Reynolds-based correction is the strongest option for broad liquid-viscosity operation because it retains the physics represented by the calibration data [S1][S4]. A temperature-viscosity correction, such as a flow computer that receives turbine frequency and fluid temperature, is more practical than an arbitrary cSt conversion but still depends on a valid fluid-property relation and the meter-specific curve [S5].
Symptom, root cause, and corrective action
Symptom: indicated flow changes while a process flow condition remains unchanged. Root cause: temperature altered viscosity, density-based volume conversion was applied without correction, or the meter is operating outside its calibrated fluid and temperature envelope. Corrective action: record fluid temperature, determine kinematic viscosity, apply the validated meter-specific correction, and compare turbine frequency with a reference meter before adjusting the PLC scaling [S4][S5].
Symptom: frequency is stable but volume flow is wrong at low flow. Root cause: the installation is in the nonlinear region where bearing friction, magnetic detent, and viscosity effects produce a pronounced K-factor hump [S5]. Corrective action: repeat the calibration at the required low-flow points and use the low-flow portion of the polynomial or curve, rather than extending a high-flow K factor downward.
Symptom: a cSt-corrected value disagrees with prover results. Root cause: a generic Hz-per-cSt factor was applied, or a UVC from another meter was reused. Corrective action: discard the conversion, verify the frequency and flow units, and recalculate the meter curve from the actual calibration points [S1][S4].
Symptom: agreement is poor only during commissioning. Root cause: air, entrained gas, insufficient straightening, or unstable inlet conditions disturbed the turbine response. Corrective action: establish the required inlet conditions and repeat a controlled prover comparison; do not conceal a hydraulic installation defect with a viscosity correction. Replacement or escalation is appropriate when the meter cannot reproduce its calibration curve, the rotor or bearings are damaged, or required operating conditions fall outside the manufacturer’s validated envelope [S3].
Sourcing, standards, and acceptance criteria
Specify the meter model, nominal size, sensor type, flow range, turndown, fluid list, pressure and temperature limits, calibration fluid, prover volume, prover uncertainty, frequency output, and required correction method. ISO 5167 addresses flow measurement by differential-pressure devices and should not be cited as the governing standard for a turbine meter’s UVC [S1][S4].
The acceptance criterion should be an agreed uncertainty and flow-error limit checked at specified points, not a visual match to a generic curve. NIST’s prover example uses a 0.074% uncertainty at the 95% confidence level [S1]. A laboratory turbine calibration has also achieved repeatability of ±0.05% and overall accuracy of ±0.25% of reading over a wide turndown when correctly calibrated [S3].
Use IEC 61508 or IEC 61511 for functional-safety evaluation where the turbine measurement participates in a safety instrumented function, but neither standard converts a turbine’s frequency response into a Hz-per-cSt law. For custody-transfer or fiscal use, apply the applicable national metrology rules to the complete measuring system rather than relying on UVC theory alone [S3].
For pulse handling and PLC scaling, separately verify whether the controller counts raw frequency or scaled volumetric pulses; Scale Turbine Meter Pulses for PLC High-Speed Counting addresses that control-layer task without changing the metrological calibration.
Record the prover uncertainty, fluid viscosity and temperature, frequency, calculated flow, deviation from reference flow, and correction coefficients for every calibration point. A complete calibration package must also identify the ranges in which the UVC is valid and those in which bearing-dependent behavior remains [S1][S4].