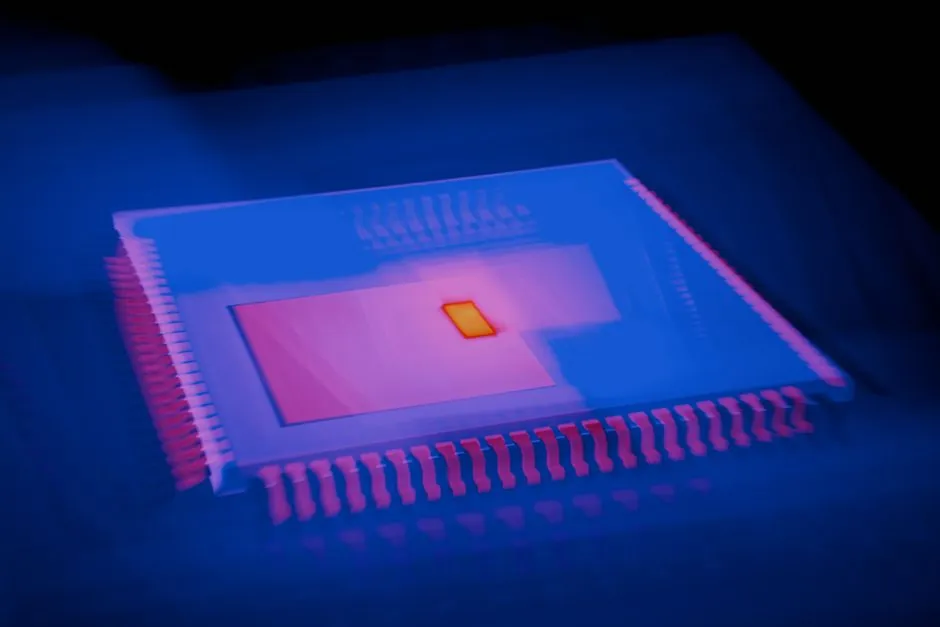
Memory revenue is projected at $550–570 billion for 2026, with DRAM, NAND and HBM shaped by AI infrastructure demand, constrained wafer output and long fab investment cycles [S1][S2].
Decision Frame: DRAM Leads Tightness, NAND Leads Storage
DRAM is volatile working memory, while NAND flash provides persistent storage in SSDs, smartphones and data-center systems; HBM is a DRAM derivative designed for accelerator bandwidth [S5]. The functional split matters because DRAM captures processor-adjacent capacity and pricing power, while NAND remains tied to storage-device builds and installed storage demand [S1][S5].
Conventional DRAM ASPs were projected at $1.20–1.30 per gigabit, with projected DRAM pricing rising about 275–300% from 2025 through 2027 [S1].
This is not a recommendation to stop qualifying NAND products. It is a ranking of marginal scarcity. DRAM has the stronger 2026 tightness signal, while NAND allocation depends more heavily on storage capacity, device volumes and layer-count economics.
Capex Split Criteria: Scarcity, Capacity and Revenue
Three criteria separate the two segments: the 2026 shortage estimate, the revenue trajectory and the response time of new capacity. Projected memory revenue of $550–570 billion in 2026 provides a common market envelope rather than a disclosed DRAM-versus-NAND capex split [S1].
The 2026 supply problem is therefore not an inventory logistics issue: clean-room construction and production ramp remain physical constraints [S1][S3].
The comparison is:
DRAM offers stronger 2026 scarcity, greater exposure to HBM allocation and a faster structural revenue case, but it carries heavier wafer-area penalties when HBM displaces conventional DDR5 and LPDDR output [S1][S3]. NAND is directly relevant to SSDs and devices, but flat mobile NAND demand and falling PC shipments can weaken its unit-growth case [S1][S3].
For buyers, this supports more aggressive DRAM contract coverage, selective NAND reservations, and configuration discipline. For suppliers, it supports capacity and packaging investment where the technology can earn a scarcity premium rather than undifferentiated bit additions.
AI Demand Changes the Mix, Not Just the Total
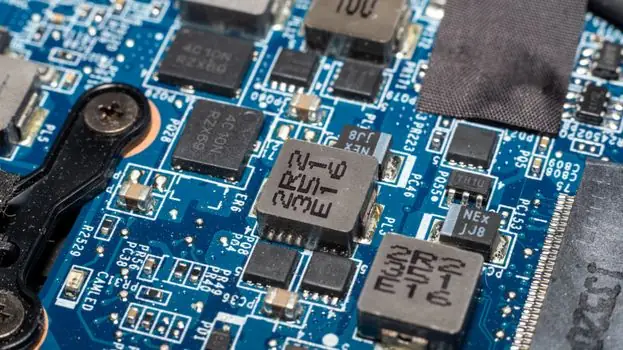
AI infrastructure changes the technology mix because HBM consumes substantially more wafer area per output bit than standard DDR or LPDDR, reducing commodity DRAM available to PCs and other devices [S3].
Hyper-scale demand also creates a procurement asymmetry. PC vendors are competing with customers able to sign multi-year agreements and commit larger infrastructure budgets, while mobile NAND demand was expected to remain flat year over year in 2026 for the first time in NAND industry history [S1][S3].
Where the Spend Differs by Customer
Data centers and AI clusters are the strongest case for DRAM and HBM-weighted spending. The 2026 PC contraction and memory-cost headwinds make flexible OEM allocation especially important [S3].
Industrial, automotive, medical and networking applications offer a more stable NAND demand profile, although growth prospects are limited and major suppliers have reduced expansion incentives [S4]. MLC NAND capacity was forecast to fall by more than 40% in 2026 following Samsung’s March 2025 announcement to end MLC NAND production [S4].
Mobile devices support both memory types, but flat 2026 mobile NAND demand and falling PC shipments make shipment growth a weak spending anchor [S1][S3]. Storage-focused buyers should favor contract coverage and SKU rationalization rather than assuming unit growth will absorb higher component prices.
DRAM Capacity Expansion Carries Higher Execution Risk
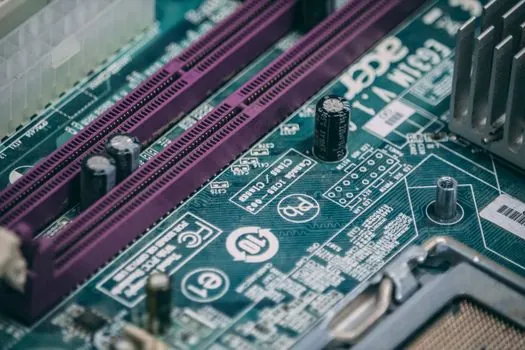
DRAM supply expansion has a long, capital-intensive lead time because fab construction, clean-room qualification, process maturity and yield improvement cannot be compressed into one quarter [S1][S2].
The technical bottleneck is signal integrity. DRAM bitlines and sense amplifiers now dominate scaling constraints; incremental shrinkage reduces signal margin and increases variability, while manufacturing and temperature variation can produce read errors [S2]. DRAM density increased only about 2 times over the past decade, compared with roughly 100 times per decade during the industry's peak scaling era [S2].
NAND expansion has a different risk profile. High-layer NAND fabrication is power-intensive, elevated energy costs raise operating expenses, and export controls can constrain the global contribution of expanding Chinese output [S4]. The forecast for MLC capacity above 40% lower in 2026 therefore supports scarcity in a defined legacy category, not a claim that all NAND technologies contract equally [S4].
This distinction argues for separating advanced TLC NAND, enterprise SSD products and legacy MLC commitments. A capacity forecast for one NAND category cannot be applied to another without qualification data and product mix.
Procurement and Allocation Rules for 2026
Use a two-stage allocation rule: cover DRAM first where contract pricing and qualification lead times make supply interruption costly, then protect NAND capacity according to storage growth and device-specific demand. The modeled 4–6% DRAM shortage and 3–5% NAND shortage provide the starting point, not a substitute for supplier capacity data [S1].
Do not use revenue growth as the allocation metric. Memory revenue was projected to rise by roughly $208 billion from 2025 to 2026, but semiconductor unit volumes were projected to grow only about 4% annually through the end of the decade, with 14% revenue compounding driven primarily by ASP [S1]. That combination favors pricing power, but it also makes budget assumptions fragile if supply catches up.
Supplier concentration is another constraint: Samsung, SK Hynix and Micron controlled almost 90% of total memory-chip production in the cited Q2 2026 estimate [S5]. Dual sourcing should therefore test package, speed grade, controller and firmware compatibility, not only manufacturer diversity.
For PC and consumer-device programs, revalidate each bill of materials against the $90–165 per-unit memory cost increase, compare it with the affected segment's ASP band, and model both volume reduction and price pass-through [S3]. For data-center programs, reserve qualified DRAM and HBM against deployment schedules and test the impact of HBM's larger wafer-area consumption on conventional supply [S1][S3].
The cleanest 2026 split is therefore not a fixed DRAM-versus-NAND percentage. It is a priority order: allocate first to scarce DRAM and qualified HBM, then to NAND categories with durable storage demand, while reducing low-volume SKUs whose memory cost would exceed 23% of retail ASP [S1][S3].
Track two signals for subsequent contract rounds: whether modeled DRAM undersupply remains within 4–6% and NAND within 3–5%, and whether the 2026 fab additions scheduled for the second half of 2027 begin to change qualified wafer output [S1].