Adhesive lap-shear strength is not a single number; it is a curve that drops 25-50% within 20-30 °C of the polymer glass transition temperature (Tg), and full strength retention above 150 °C requires a thermoset (heat-cured epoxy, melamine formaldehyde MF, phenol resorcinol formaldehyde PRF) rather than a thermoplastic such as polyvinyl acetate (PVAc) [S1][S3].
The temperature window that matters in practice spans roughly -40 °C to +250 °C, the range a modern tensile testing machine with a thermostatic chamber can sweep per ISO 4587, JIS K 6850, or EN 302-1 [S1][S5]. For engineers comparing options, the four-axis decision is chemistry family, Tg vs service temperature, test standard, and derating policy.
Why a derating curve, not a single number
A single lap-shear value quoted at 23 °C is misleading the moment the bonded joint sits on a rooftop, engine bracket, or oven plenum. Bernaczyk et al. (2023) tested five wood-adhesive groups on beech per EN 302-1:2013-06 from 20 °C to 200 °C and ranked them by residual strength and wood failure percentage (WFP) at 200 °C: thermosets (MF, PRF) first, elastomers (1C-PUR, EPI) second, thermoplastic PVAc last [S1]. The same study showed that 1C-PUR surpassed PVAc in the 20-150 °C band because PUR cures further on heating, while PVAc softens as soon as the bulk approaches its Tg [S1].
The shape of the curve is repeatable across chemistries: flat or slowly rising strength from -40 °C up to roughly Tg - 40 °C, a steep fall through the Tg window, and a low residual plateau above Tg + 30 °C. Shimadzu reports tensile-shear measurement in a thermostatic chamber from -40 °C to 250 °C and samples at up to 10 kHz to capture brittle-failure events during the steep transition [S5]. Master Bond adds that heat-cured epoxies hold mechanical properties after prolonged high-temperature exposure, while room-temperature-cured epoxies lose strength earlier [S3][S7].
Chemistry families ranked by thermal headroom
For spec writing the practical ordering from highest to lowest usable service temperature is: heat-cured (high-Tg) epoxies and bismaleimides, MF/PRF thermosets, one-component moisture-cure polyurethanes (1C-PUR) and EPI elastomers, two-component room-temp epoxies, cyanoacrylates, then PVAc and other thermoplastics [S1][S3][S7]. The first group retains useful shear strength at 150-200 °C because the crosslinked network does not flow, the second group softens between roughly 60 °C and 120 °C, and PVAc drops sharply between 50 °C and 80 °C in the Bernaczyk dataset [S1].
NASA design-allowables work by Owen (1972) on four structural adhesives established the same shape above the polymer Tg, with each chemistry's curve plateauing at a different residual fraction; the report is still used as the reference for plotting high-temperature design allowables for aerospace bonds [S2]. For process engineers this means the curve is not a generic slope; the slope, knee temperature, and residual plateau are all chemistry-specific and should be plotted, not interpolated from a datasheet single point.
Lap-shear vs tensile (normal) strength is a separate axis, but it interacts with temperature. Shear strength measures resistance to forces parallel to the bond line (sliding, lateral load), while tensile strength measures resistance to forces perpendicular to the bond line (pull-apart, peel initiation) [S4]. On a real joint the two combine, and NPL notes that a single lap specimen under tension generates a mixture of shear and tensile (peel) stresses whose ratio depends on joint geometry and adherend stiffness [S9]. For temperature derating, run the lap-shear test (ISO 4587 / JIS K 6850) as the primary curve and add a hot-tensile pull-off test for safety-critical joints.
Test methods that produce a usable curve

Three standards cover most industrial lap-sher tests: ISO 4587 (adhesive, rigid-to-rigid, lap shear), JIS K 6831 / JIS K 6850 (Japanese equivalents used widely in Asian automotive supply), and EN 302-1:2013-06 (structural wood adhesives) [S1][S5]. All three use a single-lap specimen loaded in tension; the difference is specimen geometry, conditioning, and substrate. For a derating curve the engineer specifies at least five temperature points: -40 °C, 23 °C (room-temp baseline), one point at Tg - 30 °C, one at Tg, and one at Tg + 30 °C, with a thermostatic chamber dwell of 10-15 min before pull to let the bond line equilibrate [S5].
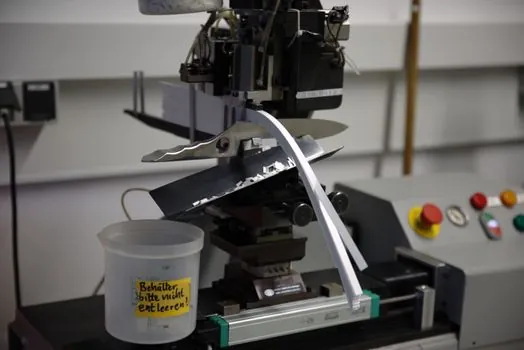
For automotive under-bonnet, brake, or desert-sun service, Shimadzu's published work demonstrates the full -40 °C to 250 °C sweep on the AGX-V2 universal tester with a 10 kHz sampling rate, fast enough to catch the brittle-fracture spike in epoxy bonds as the temperature crosses Tg [S5]. The same methodology applies to any precision temperature controller driven chamber; the key spec is ramp uniformity (±2 °C across the grip area) and load-cell resolution that can resolve the post-Tg drop without saturating.
For a related decision matrix on joint geometry that drives the same test data, the comparison in Lap vs Butt Adhesive Joints: Shear Strength Design Trade-offs lines up the lap, butt, and scarf configurations against the same ISO 4587 dataset, and is a useful companion read when the bond geometry is still open.
What the curve actually tells you at each point
Below Tg - 30 °C, shear strength is roughly flat or slightly higher than the 23 °C baseline, because the polymer is glassy and stiff; some epoxies and PRF systems peak in this band rather than at 23 °C [S1][S2]. From Tg - 30 °C to Tg, strength falls 15-30% as the polymer enters the transition zone, and the failure mode shifts from cohesive to a mix of cohesive and adhesive. From Tg to Tg + 30 °C, strength drops another 40-60% of the room-temp value, and the failure mode becomes largely adhesive or substrate-yielding (in wood joints, the wood itself fails, which is the WFP metric Bernaczyk used to rank adhesives) [S1]. Above Tg + 30 °C, the curve plateaus at a low residual (often 10-25% of the room-temp value) until thermal decomposition begins.
The practical design rule used in the Master Bond and Design World guidance is to apply a 2x to 4x safety factor on top of the derated value, and never to specify a thermoset above roughly 80% of its Tg in Kelvin for sustained load [S3][S7]. For high-temperature epoxy and silicone systems the rule is tighter: continuous service is typically capped at Tg - 20 °C to Tg - 40 °C, with excursions to higher temperatures treated as transient and accounted for separately [S3].
How to apply the derating on a real spec
Step 1: pick the chemistry family by service temperature. Under 80 °C continuous, two-part room-temp epoxy or PUR is fine; 80-150 °C needs heat-cured epoxy, MF, or PRF; 150-200 °C needs high-Tg epoxy, bismaleimide, or silicone; above 200 °C the organic options close out and the joint must be mechanical or ceramic-bonded [S1][S3][S7]. Step 2: ask the supplier for a lap-shear curve to ISO 4587 or EN 302-1 with at least five temperature points including the worst-case service temperature plus 25 °C of margin. Step 3: plot the curve, mark the Tg from DSC, and read the derated strength at the actual service temperature. Step 4: divide by the design safety factor (commonly 2.5-4.0 for structural joints) to get the allowable stress. Step 5: recheck after a hot-wet ageing cycle, because humidity and temperature together degrade most adhesives faster than heat alone [S3][S6].
The Nagase Chemtex five-parameter study is worth flagging here: optimising temperature, time, humidity, pressure, and mix ratio on a single adhesive can raise shear strength by up to 30% even with no formula change [S6]. That is one reason a derating curve from one supplier should not be ported to another supplier's "equivalent" product without re-test, the curve is the chemistry plus the process window, not the chemistry alone.
Common failure modes and what the curve hides
The derating curve does not capture creep, fatigue, thermal cycling, or chemical attack, and any of these can pull a joint's working life below the static curve's prediction [S3]. A bond that holds 60% of its room-temp strength at 120 °C in a one-shot pull test can still fail in weeks under sustained load at 100 °C, because creep rupture scales with temperature roughly as an Arrhenius function of (T - Tg). For cyclic service, lower-cycle thermal-shock tests and fatigue shear tests are needed alongside the static curve [S3].
Substrate matters as much as adhesive. On wood, the WFP climbs with temperature, so the curve flattens when the wood itself becomes the weak link [S1]. On metal, the curve is usually adhesive-limited, but surface preparation (grit blast, solvent wipe, primer) shifts every point on the curve by 10-30% and is the single biggest uncontrolled variable in field failures. On composites and plastics, differential CTE between adhesive and adherend can drive peel stress that the lap-shear test does not see, so a hot-tensile or wedge-test result should be added to the spec package [S4][S9].
When the derating curve is the wrong tool

Skip the lap-shear derating approach entirely for peel-dominated joints (clamped panels, thin laminates, film adhesives), for joints under sustained tensile load where creep dominates, and for any bond that sees thermal cycling across a wide delta-T, because the fatigue envelope, not the static curve, controls life [S3][S4]. In those cases the right test is a wedge test, a climbing-drum peel test, or a cyclic-T fatigue run, each with its own derating policy. The lap-sher curve is the right tool when the dominant service stress is parallel to the bond line, the temperature is roughly steady-state, and the load is static or slowly varying, which covers most structural and industrial assembly joints.
For shop-floor quality control, the simplest live signal is to pair a temperature monitor on the cure zone with a temperature recorder logging the bond-line cool-down, and to reject any joint whose cure profile strays outside the ±5 °C band the supplier's lap-sher curve was generated under. And for general context on the industrial adhesive families and their temperature behaviour, the encyclopedia entry is the right starting reference.