
Global aluminum consumption is projected to reach 120 million tonnes by 2030, expanding at a 4.2% CAGR over 2024–2030, with APAC alone accounting for 42% of 2023 volumes [S1].
Behind that headline, February 2026 institutional analysis flagged an accelerating mismatch: demand growth is running ahead of new primary capacity additions, producing structural deficits rather than cyclical tightness, with renewable energy and electric vehicle intensity per unit rising faster than per-capita GDP-linked baseline models assumed [S3].
Demand Pools: Where the Tonnes Go
Transportation, construction, electrical and consumer durables, foils and packaging, and machinery and equipment make up the five end-use buckets tracked in the headline forecast, with transportation and packaging called out as the two growth-opportunity segments for 2024–2030 [S1]. APAC is the dominant region at 42% of 2023 share, followed by North America and Europe, and Japan is a near-term catalyst with the Osaka 2025 World Expo backed by roughly 5.8 billion USD in committed venue and access infrastructure spend [S1].
The aluminum casting sub-segment, which spans die casting and permanent mold casting, is sized separately and tracked through 2033 by end use across transportation, industrial, and building and construction, reflecting how downstream forming capacity is the gating constraint rather than raw melt [S2]. Within the broader metals complex, copper and aluminum are both expected to see moderate, cost-led growth in 2025–2026, with industrial demand rather than financial flows setting the marginal price [S4].
EV and Aerospace: Per-Unit Aluminum Intensity
Battery electric vehicles consume 180–200 kg of aluminum per vehicle, against 140–160 kg for conventional internal combustion engines, a 30–40 kg per-unit uplift that scales linearly with global BEV output [S3]. Electric vehicle battery housings use specialised aluminum alloys chosen for thermal management alongside structural stiffness, while commercial vehicle makers add aluminum content to offset traction-battery mass and hold operating range targets [S3].
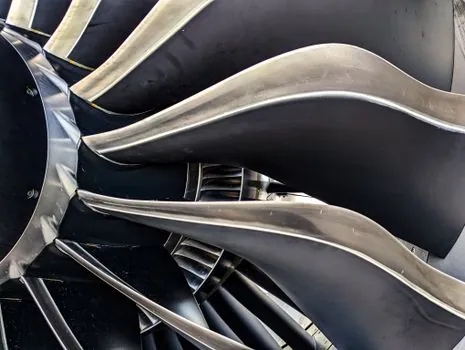
Aerospace recovery is tied to commercial aviation ramp and next-generation airframes; both Boeing and Airbus production schedules use advanced aluminum-lithium alloys for weight reduction while preserving existing airworthiness certification paths [S3]. Marine is the third mobility bucket pulling aluminum tonnage, with operators specifying lighter hulls and superstructures to meet fuel-efficiency and emissions rules [S3]. Process engineers sourcing aluminum alloy for these programs should pin the per-unit intensity figure (180–200 kg BEV vs 140–160 kg ICE) to the program BOM rather than to a generic density argument, because the binding constraint is formability and crash energy management, not raw metal supply.
Renewable Energy: Solar and Wind Aluminum Pull
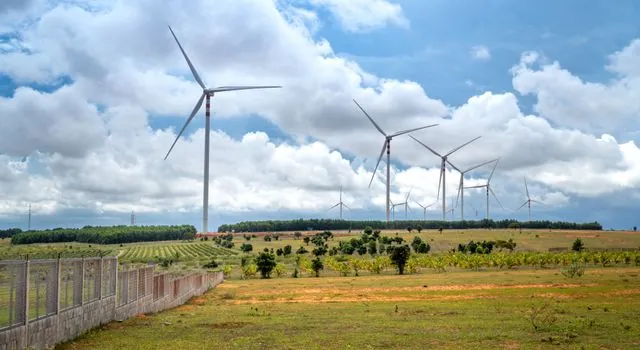
Solar PV uses 7–8 tonnes of aluminum per megawatt across frames, trackers, and electrical components, and global solar buildout targets through 2030 translate to more than 2.5 million tonnes of annual aluminum demand from this sector alone [S3]. Wind turbines add a second stream through aluminum conductors and structural pieces in power transmission, with offshore wind projects the heaviest users per installed megawatt [S3].
For aluminum veneer panel and framing buyers, the operative 2026 planning number is the 7–8 t/MW solar intensity, because it lets a procurement team convert a public MW pipeline into a tonnage call without waiting on a fabricator allocation. The same logic applies to grid-side conductor pulls, where aluminum conductor steel-reinforced (ACSR) and all-aluminum alloy conductor (AAAC) choices feed the 2.5 million t/yr solar envelope plus an unquantified but rising wind tranche.
Supply Side: Capacity Lag and Smelter Energy
Recycled aluminum cuts energy use by up to 95% versus primary smelting from bauxite, which is why European and North American circular-economy programs are pulling secondary supply into the same pool that EV and solar buyers draw from [S1]. Smelters are increasingly pairing renewable power purchase agreements with primary capacity to defend carbon footprint on automotive and packaging offtake, a configuration that the headline 120 Mt 2030 figure already bakes in but that is not broken out separately in the public release [S1].
For buyers specifying gas aluminum melting furnace equipment or secondary melting lines, the 95% energy-saving anchor is the right benchmark for capex justification, because operating cost on gas-fired reverberatory or tilting furnaces is dominated by fuel per tonne of liquid metal, and recycled feedstock in the charge mix directly cuts that line. The structural deficit signal from February 2026 analysis, demand growth ahead of new capacity [S3], is the second leg: secondary capacity expansions are now underwritten, not optional, because primary smelter lead times run 4–6 years from FID to first metal.
Regional Sourcing: APAC, North America, Europe

APAC’s 42% 2023 share is concentrated in China, Japan, South Korea, India, Australia, and New Zealand, with key producers CHALCO and Hongqiao Group plus RUSAL, Alcoa, Rio Tinto Alcan, Emirates Global Aluminum, and Norsk Hydro rounding out the global supplier set tracked in the IndustryARC release [S1]. The US Infrastructure Investment and Jobs Act directs capital toward aluminum-intensive projects, though consumption timing varies with project schedule rather than with commodity price [S3].
European demand is shaped by EV build schedules, packaging regulation, and recycled-content mandates; North America by automotive lightweighting, beverage can stock, and grid modernization; APAC by construction, electronics, and the Osaka 2025-driven Japanese build pipeline [S1][S3]. Sourcing teams that maintain dual-region qualification, for example an APAC mill for aluminum window door extrusions and a European secondary smelter for can-stock, are typically better hedged against the 2026 deficit signal than single-region buyers.
Options Compared: Primary vs Recycled, Cast vs Extruded
Primary aluminum (bauxite to alumina to electrolysis) carries the highest carbon footprint and energy cost but offers the tightest alloy control for aerospace and EV-body sheet; recycled (secondary) aluminum cuts energy use by up to 95% and is the default feedstock for casting and many extrusion programs where 1xxx and 3xxx series chemistries are acceptable [S1]. Castings (die and permanent mold) dominate transportation structural parts and complex housings; extrusions dominate building and construction, especially aluminum ladder and curtain-wall profiles, because the extrusion press lets long, constant-section shapes run at low per-kg cost.
Flat-rolled product (sheet and plate) is the bottleneck for automotive body-in-white and can-stock, with the can-stock end binding on North American and European packaging demand [S1][S2]. Forgings and pigments and powder sit at the low-volume, high-margin tail of the mix and rarely move the headline tonnage figure, but they are the segments where aluminum die casting machine selection gates automotive program timing.
What This Means for 2026 Procurement
Three signals to track through year-end 2026: first, monthly primary aluminum inventories on the LME and SHFE, which lead spot premium moves by 4–8 weeks; second, BEV production prints from China, Europe, and North America, which gate the 180–200 kg/vehicle intensity figure into realized tonnage; third, solar and offshore wind MW awards, which feed the 7–8 t/MW solar anchor and the unquantified but rising wind pull [S3].
The structural-deficit framing from February 2026 institutional analysis argues for locking 2026–2027 tonnage under quarterly index-linked contracts rather than spot buying, and for qualifying a secondary smelter alongside any primary offtake [S3]. For an adjacent read on how aluminum buyers are handling 2026 spec gates, the engineering plastic selection for automotive 2026 spec gates piece tracks the same lightweighting per-vehicle logic on the polymer side, and the rare earth demand 2026-2030 brief covers a parallel structural-deficit story for magnet and motor materials, both of which sit alongside aluminum in the EV BOM.