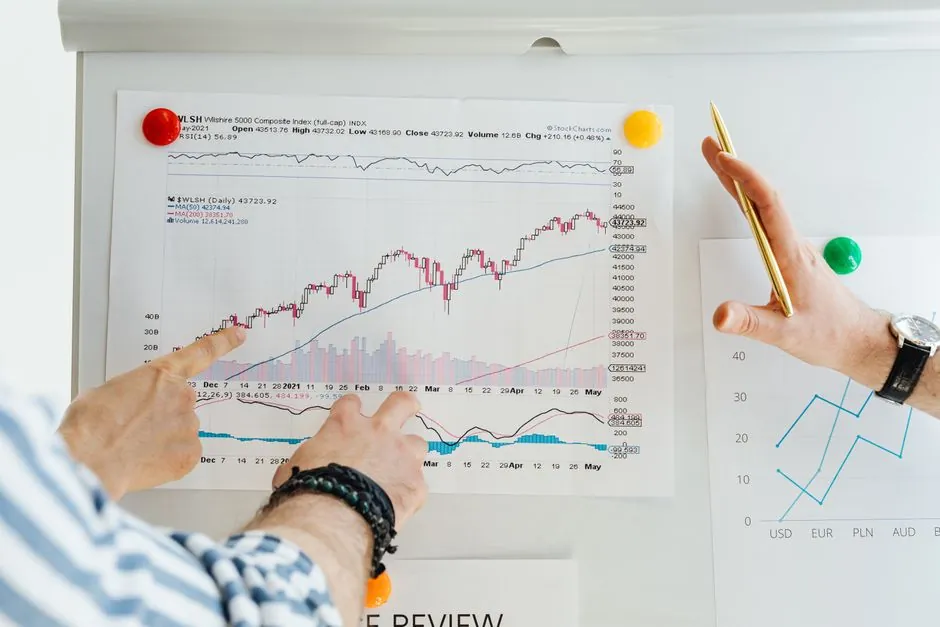
Global aluminum ingot demand is projected to climb from USD 103.6-268.12 billion in 2026 to USD 163.5-329.67 billion by 2031, depending on forecast horizon and methodology, with 4.22-5.2% CAGR bands [S2][S5].
Asia-Pacific retains 53.46-62% of 2025 demand by value, anchored by China's roughly 40-43 million metric tons of annual primary output, while Middle East and Africa log the quickest 4.97% CAGR to 2031 on subsidized gas and proximity to Indian fabricators [S1][S2][S5].
Primary vs. Secondary Ingots: Why the Mix Is Tilting
Primary ingots still dominate the volume base at 62.41-68% of 2025 revenue share, supported by Hall-Héroult capacity additions in China, the Gulf, and India, but secondary (recycled) ingots are growing 5.32-6.4% CAGR, roughly 1.0-1.2 percentage points faster than primary [S2][S5].
Procurement teams should expect secondary supply to capture most of the post-2027 incremental tonnes as automakers close scrap loops for Scope 3 reporting; the closed-loop recycling partnership model is now flagged as a top opportunity in supplier roadmaps [S5]. For melting-side decisions, this shifts spec weight toward gas aluminum melting furnace throughput and rotary degassing, since recycled feedstock carries higher oxide and Mg-loss risk than primary sow.
End-Use Pull: Transport, Construction, Electrical
Transportation held the largest application share at roughly USD 31.2 billion in 2025 and is expanding as battery-electric vehicles carry 20-30% more aluminum than internal-combustion equivalents, lifting North American per-vehicle content from 220 kg in 2025 toward 250 kg by 2030 [S2][S5].
Building and construction led 2025 revenue at 34.28% share, expanding at 5.5% CAGR on green-building facades, while India's USD 1.4 trillion National Infrastructure Pipeline routes roughly 30% of capex into aluminum-heavy rail and power assets [S2]. Electrical demand (cable, busbar, solar racking) is the smallest of the four but the most feedstock-sensitive to low-carbon premiums because copper-to-aluminum substitution is technically straightforward above 1 kV.
Decarbonization Premium: CBAM, Inert-Anode, Hydropower
Border-carbon rules in the EU, UK, and Canada are steering premia toward smelters running hydropower or inert-anode cells, with inert-anode and low-carbon smelting adding an estimated +0.6% to the ingot-market CAGR on a long-term basis [S2].
Rio Tinto and Alcoa's ELYSIS joint venture committed over USD 550 million to commercialize zero-carbon smelting by 2027, while Canada, Norway, and Iceland are offering subsidized hydroelectric capacity to anchor next-generation smelters [S5]. The EU CO₂ fleet target, a 55% reduction by 2030 against 2021 baselines, is the regulatory pull-through that converts automotive lightweighting from optional to mandatory, with per-vehicle aluminum content now expected to rise from roughly 180 kg toward 250 kg [S5].
Criteria-Based Comparison of the Main Sourcing Options
Specifiers weighing primary, secondary, and low-carbon-certified ingots can line up the three options against four decision criteria. On cost, primary remains the cheapest at spot but carries the highest embedded carbon; secondary trades a 5-15% discount for tighter melt-control overheads; low-carbon certified carries a 10-20% premium that EU and UK buyers can offset via CBAM credits [S2][S5].
On carbon intensity, primary Hall-Héroult averages 11-16 t CO₂/t Al depending on the power mix, hydroelectric smelters in Canada and Norway drop to under 2 t CO₂/t Al, and secondary loops below 1 t CO₂/t Al when scrap is clean [S2][S5]. On lead time, primary sow from Chinese and Gulf smelters runs 6-10 weeks, secondary from regional recyclers runs 2-4 weeks, and low-carbon certified ingots carry 8-14 weeks because of chain-of-custody documentation. On alloy flexibility, primary P1020A supports the broadest downstream conversion, secondary is constrained by Fe and Si tramp limits, and low-carbon certified is currently available in a narrower grade envelope focused on 1xxx, 3xxx, and 6xxx series.
Regional Sourcing: Where Capacity Is Being Added
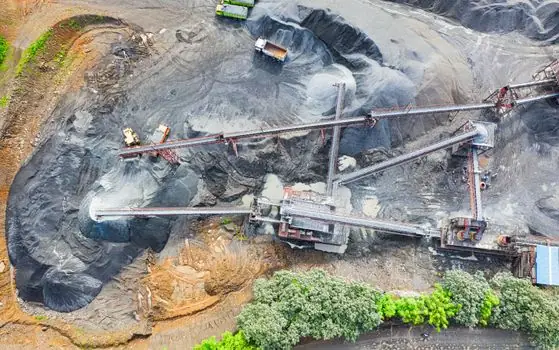
Asia-Pacific, specifically China, dominates the supply base with about 40 million tonnes of annual smelting capacity and integrated smelter-foundry complexes, while India is opening greenfield capacity under the National Aluminium Policy with 5.8% projected regional CAGR through 2035 [S2][S5].
The Middle East and Africa record the fastest growth at 4.97% CAGR to 2031 on subsidized gas and proximity to Indian fabricators, and Europe holds about 15% of global value, supported by CBAM, while North America holds about 10% on reshoring incentives [S2][S5]. The IAI's CRU-commissioned outlook sees global aluminium demand rising roughly 40% by 2030 versus 2020, with transport, construction, packaging, and electrical accounting for 75% of incremental tonnes and China absorbing 12.3 Mt of the 33.3 Mt uplift [S4].
Spec Implications for Downstream Process Engineers
For die-casting operations, the shift to secondary ingots means tighter incoming-metal checks on Fe, Si, Cu, and Mg, plus more aggressive dross handling, and specifiers should revisit aluminum die casting machine selection for higher injection pressures and vacuum assist, since recycled feed raises gas porosity risk by 15-25% relative to primary P1020A under identical machine settings [S2].
For rolling-mill and extrusion buyers, the rise of low-carbon certified premiums means procurement contracts should now require a verifiable carbon-intensity certificate per heat, and aluminum alloy selection should favor grades that tolerate higher Fe and Si when secondary feedstock is expected, namely 3xxx and 6xxx families, while 2xxx and 7xxx remain primary-only. For building-integrated applications, the aluminum veneer panel and aluminum window door categories will see construction-grade demand grow at 5.5% CAGR, and contractors should pre-qualify secondary-capable extruders now rather than chase allocations later [S2][S5].
Limitations and Failure Modes to Track

Forecast divergence is the first limitation: Mordor Intelligence and MRF bracket 2026 ingot market value at USD 103.6-268.12 billion, an order-of-magnitude gap driven by scope (ingots only vs. broader aluminum mill product) and FX assumptions, so any single number should be treated as one of several scenarios [S2][S5].
Energy-cost volatility is the second failure mode, because spot power prices can swing 30-50% quarter-on-quarter in European smelting regions and instantly change the primary-vs-secondary cost curve. Trade-policy risk is the third, with US Section 232 and EU CBAM rules potentially repricing transatlantic flows inside a single quarter, and a fourth risk is the gap between ELYSIS's 2027 commercial target and the slower ramp of inert-anode cells, which could leave the low-carbon premium structurally tight through 2028.
Standards, Sources, and Next Verification Nodes
Forecast inputs cited here draw on IAI/CRU (2022 baseline, demand through 2030) [S4], Mordor Intelligence (Jan 2026 update, ingot market through 2031) [S2], Persistence Market Research (Apr 2026, broader aluminum through 2033) [S1], Technavio (aluminum market 2025-2030) [S3], and Market Research Future (Aug 2026 update, ingot market through 2035) [S5].
Trackable next signals: ELYSIS commercial-output milestone announcements, EU CBAM verified-emissions phase-in for the aluminum HS codes, India's National Aluminium Policy greenfield capacity commissioning dates, and the IEA's 2026 update on EV unit sales, all of which will recalibrate the 2026-2030 ingot demand curve within two reporting cycles.
See also our earlier report, Push-In Fittings: Real Advantages, Honest Limits for 2026 Specifiers.