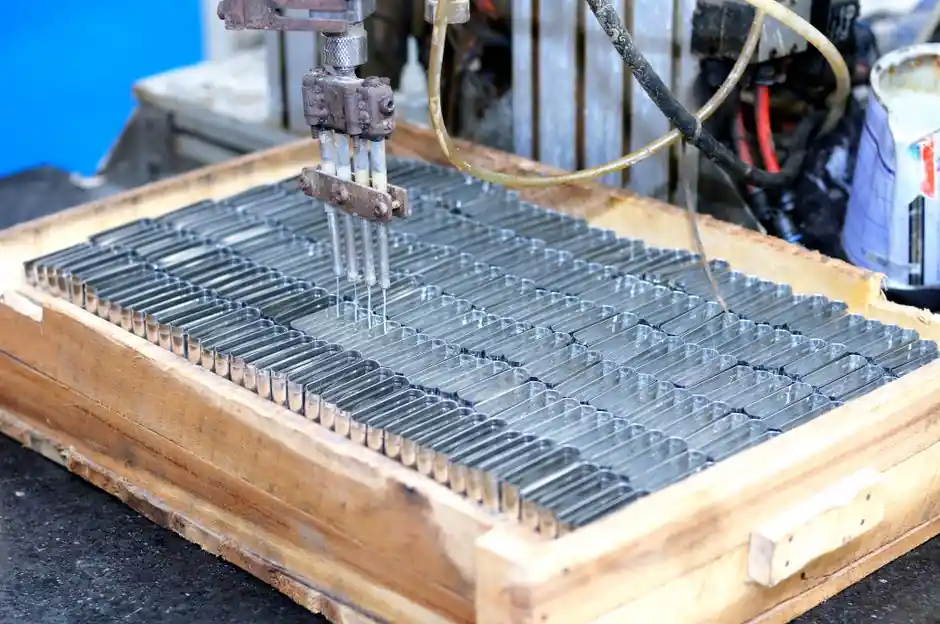
Automatic green sand molding lines push cycle times measured in seconds per mold, while lost foam casting lines run on the order of minutes per pour but eliminate cores, parting lines, and most secondary machining.
Both are highly automated, but they target different parts of the casting-process trade space: high-volume dimensional repeatability versus near-net-shape complexity on lower-volume, harder-to-machine geometries.
Cycle Throughput and Line Footprint
Green sand automatic molding lines have outpaced lost foam on raw cycle time for decades: the lost foam process is "slower compared to green sand molding lines" [S1], and the typical lost foam line footprint is about 100 feet long, compact and usually highly automated [S6]. In practice that means an automatic molding line will deliver more molds per hour at the same labor count, while a lost-foam casting line trades raw throughput for geometry capability.
For shops running medium to high volumes, throughput is the dominant cost driver, which is why cycle economics are dissected in the Automatic Molding Line Molds-per-Hour breakdown and the Automatic Molding Line TCO vs Labor Savings 2026 cost analysis.
Dimensional Accuracy and Surface Finish
Lost foam casting delivers ±0.005 mm/mm linear tolerance with surface roughness in the 2.5-25 µm range, versus sand casting's rougher finish that demands extensive post-processing [S2]. The reason is structural: green sand tolerates core movement and shift between mold halves across the parting line, which limits feature accuracy, while lost foam uses no cores or mold halves to shift and degrade feature accuracy [S7].
Lost foam also removes draft and parting lines because the foam pattern is identical to the final part and vaporizes on pour, making it a strong fit for intricate internal passageways that would otherwise need assembled cores [S3][S4].
Material, Energy, and Scrap Efficiency
Lost foam eliminates risers and exothermic sleeves, reducing metal consumption, and roughly 98% of the sand can be reused on closed-loop systems [S2]. Energy use runs about 27% lower than green sand, and per-part production cost lands 20-50% below sand casting, with one source citing up to 35% direct savings on comparable geometries [S2].
These savings come from cutting binders, core-making, and finish machining rather than from the pour itself. The process is dry: no chemical binders, no sand wastage, and no riser metal to remelt and refeed [S2].
Process Architecture and Automation Stack
Both lines are conveyor-driven and PLC-governed, but their station counts diverge. A green sand automatic line centers on sand mixing, mold forming, closing, and flask handling, all covered in the molding line and molding references. A lost foam line adds foam-pattern fabrication, refractory coating dipping and drying, and unbonded sand fill with vacuum assist before pour [S4][S8].
The shared layer is electrical automation and level control: servo-driven squeeze, automatic level sand or sand-and-compound fill, robotic flask and pattern handling, and pouring-ladle automation. Cycle timing and squeeze force on the sand side are covered in the hydraulic squeeze pressure spec ranges article.
Decision Matrix: Which Line Fits the Job
Across the four decision criteria that matter at procurement, the comparison reads as follows. On cycle time, automatic green sand wins. On dimensional accuracy, lost foam wins (±0.005 mm/mm vs typical green sand looser tolerance). On surface finish, lost foam wins (2.5-25 µm vs sand-cast roughness that needs grinding). On per-part cost for complex geometry, lost foam wins (20-50% lower) [S2][S7].
Pick automatic molding for high-volume, simple-to-moderate geometry parts where throughput and tooling cost dominate the unit economics. Pick lost foam for complex internal passageways, engine blocks, cylinder heads, pump housings, and valve bodies where eliminating cores and machining outweighs the slower cycle [S2][S4].
Process Limits and What Each Line Cannot Do
Lost foam is restricted to foam-pattern-compatible geometries, and the polystyrene pattern must survive refractory coating, sand fill, and metallostatic head without collapse. Foam density and coating permeability have to be tuned per alloy, and vaporized-pattern gas has to vent through the refractory, which constrains pour rates and section thickness [S4][S8].
Automatic green sand lines are limited by flask size, parting line draft, and the achievable density profile from the squeeze station; the hydraulic squeeze pressure article covers the control trade space. Both lines share upstream limits on molten-metal temperature stability and ladle scheduling, which set the floor on cycle time regardless of station automation.
Standards, Sourcing, and Trackable Signals
Lost foam tolerancing claims cited here trace to OC Technology's published data table (±0.005 mm/mm, 2.5-25 µm, 20-50% cost, 27% energy, ~98% sand reuse) and to TFG USA's 2026-05-28 process guide, which restates the evaporative-polystyrene, unbonded-sand architecture [S2][S4]. Green-sand accuracy limitations are corroborated by SFSA's tutorial on parting-line shift and the Modern Casting 2020 footprint figure of about 100 feet for a typical lost foam line [S6][S7].
Trackable signals to watch on the next 6-month window: published cycle-time updates from automatic molding line builders targeting >500 molds/hr at tighter sand moisture windows, and lost foam foundries publishing refractory-coating permeability data for higher pour rates on steel and iron grades beyond the current aluminum and iron dominance.