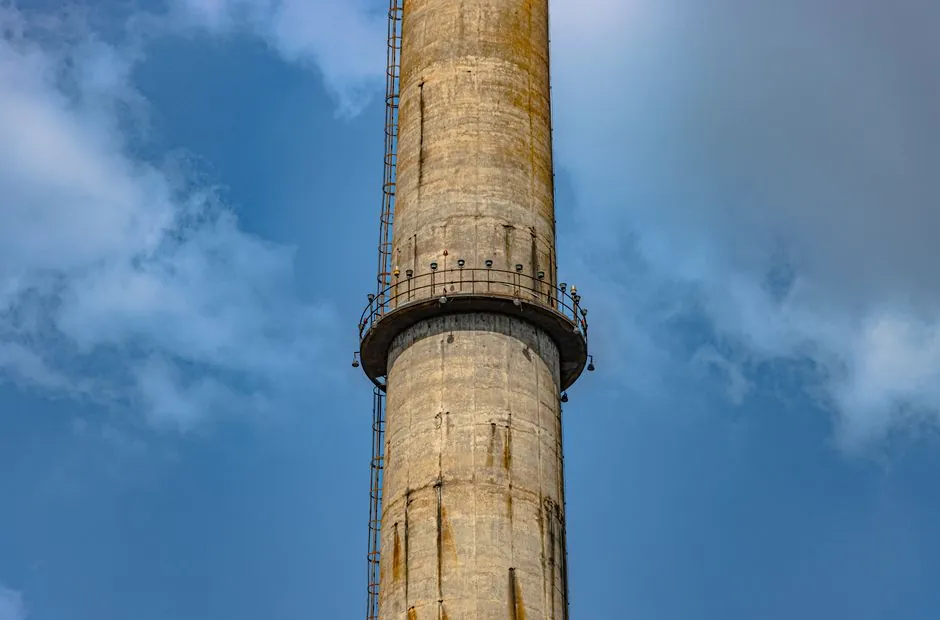
Decarbonization of cement production in 2026 is no longer a single technology race but a layered capital plan: drop the clinker factor, swap fuels, electrify the heat, and bolt carbon capture on the stack. The Mission Possible Partnership's 1.5°C-aligned sector strategy, published December 2023, still sets the global baseline: roughly 98 Gt of cumulative CO2 between 2022 and 2050 under business-as-usual, or twice the sector's 1.5°C carbon budget [S1].
Concretely, a modern kiln burns 2.8–3.6 GJ of thermal energy and draws 80–120 kWh of electricity per tonne of cement, with 55–65% of the 500–850 kg CO2/t cement footprint originating from limestone calcination, not fuel combustion, per the July 2026 MDPI assessment by Franco at the University of Pisa [S4]. That split is the reason every credible roadmap stacks levers instead of betting on one.
Where the CO2 actually comes from in a cement plant
Process emissions from calcination account for roughly 60% of US cement-making CO2 and cannot be abated by fuel switching, because the carbon is liberated by the chemical decomposition of CaCO3 into CaO and CO2, not by combustion, as quantified in the CATF 2024 whitepaper [S2]. The remaining 40% is fuel combustion, historically coal and petcoke (57.4% and 13.1% of US plant energy in 2000), now shifting toward natural gas (24.2% in 2022) and waste fuels at 15.5% combined [S2].
Per the CATF whitepaper, the U.S. cement industry consists of 92 manufacturing plants producing 91 million metric tons of cement annually and emitting 71.3 million metric tons of CO2, or 1.1 percent of total gross U.S. GHG emissions [S2]. WRI's parallel 2024 analysis counts 91 operating plants and 68 million metric tons of direct CO2, the equivalent of about 16 million gasoline cars per year, with clinker production alone responsible for 85% of cement's process emissions [S5].
Three capex buckets: clinker factor, alternative fuels, CCUS
Bucket 1 is clinker substitution. Dropping the clinker-to-cement ratio via supplementary cementitious materials (SCMs) like fly ash, slag, calcined clay, and limestone is the cheapest ton of CO2 avoided, and S&P Global's August 2026 industry conversations flagged that almost 50% of the 2026–2030 CO2 reduction in cement could come from three areas: low-carbon cement and concrete, clinker factor reduction, and the third lever disclosed in that conversation [S3]. Energy efficiency alone yields only 10–30 kg CO2/t cement of reduction at modern plants, per the MDPI 2026 analysis [S4].
Bucket 2 is fuel switching and hydrogen. Alternative fuels and clinker substitution are sized as larger but still partial levers, while hydrogen fired through oxy-fuel combustion systems can theoretically cut 50–200 kg CO2/t cement of the combustion share [S4]. The trade-off is straightforward: hydrogen is a combustion decarbonizer, not a process-emission killer, so on a 100% calcination plant it does not move the needle on the 55–65% process CO2 share.
Bucket 3 is CCUS, the only commercially serious option for the calcination stream. DOE's Industrial Demonstrations Program (IDP), managed by the Office of Clean Energy Demonstrations, has earmarked up to $1.6 billion, the largest single share of the program's $6.3 billion in awards, to six US cement projects expected to avoid 4 million metric tons of CO2 annually [S5]. That public money is matched by over $14 billion in private funding across the 33 IDP projects spanning eight heavy industries [S5]. Coal- and petcoke-fired kilns are the priority CCUS candidates because their exhaust CO2 concentration is higher, which lowers the $/tCO2 capture cost, per CATF [S2].
What the global capex bill actually looks like
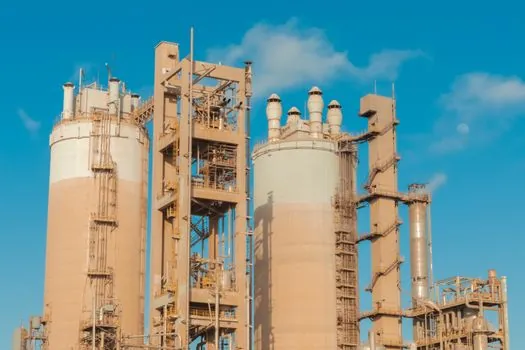
CATF's 2024 "Recasting the Future" whitepaper sizes the US policy support package at $11.4 billion in 2024 dollars (zero percent discount rate), or $10.1 billion under a social discount rate, for a comprehensive suite of cement decarbonization policies [S2]. That figure is the policy-support envelope, not the plant-level capex, and it stacks on top of the IDP demonstration awards and the estimated $65 million of federal RD&D funding for cement alone outside IDP [S5].
For comparison, the MDPI 2026 pathway assessment pegs CCS as the only technology capable of addressing the "substantial process emissions inherent to clinker production," with hydrogen relegated to a complementary role on the combustion share [S4]. A practical takeaway: any 2026 cement capex plan that does not include a CCUS line item is not a 2050 net-zero plan, it is a 2035 plan at best.
How the three options compare on decision criteria
On a 0–100 scoreboard, clinker substitution wins on $/tCO2 avoided and lead time, alternative fuels and hydrogen win on combustion-share reduction, and CCUS wins on total process emissions abated. Clinker factor reduction is the only lever with sub-five-year payback potential because the input materials are already available in many markets, and the kiln chemistry does not need retrofitting, only mix-design and standards work. Hydrogen, by contrast, is a 2030s-scale option tied to green H2 supply, and oxy-fuel integration adds capex on the burner and air-separation unit. CCUS is the heaviest capex line by a wide margin and is gated by CO2 transport and storage infrastructure within 100–200 km of the plant, which is a siting constraint, not a technology constraint [S1][S4].
The S&P Global 2026 readout also stressed plant-level feasibility: access to raw materials, CO2 storage and utilization infrastructure, and low-carbon energy supply are the three real gating variables for any project, not the technology choice on paper [S3].
Where special cement and concrete re-engineering sit in the stack
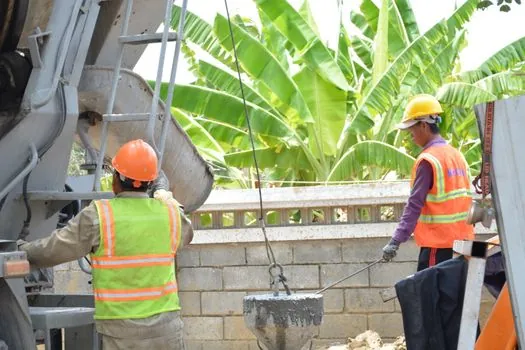
Lower-clinker cement and concrete systems, including LC3, geopolymer, and calcium sulfoaluminate binders, are the demand-side lever with the largest pre-2030 potential, per MPP's 2023 sector strategy [S1]. That is also where the policy dollars are easiest to deploy: no new kilns, no CCUS pipeline, just standards updates (EN 197-1, ASTM C595/C1157) and procurement mandates on the buy side. The 2026–2030 industry conversations put "low-carbon cement and concrete" and clinker factor reduction as the top two near-term levers, ahead of any fuel or capture investment [S3].
Limitations and what to watch by end of 2026
Three trackable signals: first, the final IDP award amounts for the six cement projects, currently under negotiation, which set the floor for US kiln-level CCUS economics [S5]. Third, EN 197-1 / ASTM C595 revisions allowing higher clinker substitutes, because that single standards lever arguably moves more CO2 per dollar than any single grant [S1]. The constraint that does not move is the 55–65% process emissions floor from calcination, which only CCUS touches, and the capex needed to deploy it at scale is the real 2026–2030 story for cement.
This topic is covered further in Carbon Fiber Price Per Kg in 2026: Industrial vs Aerospace Grade.