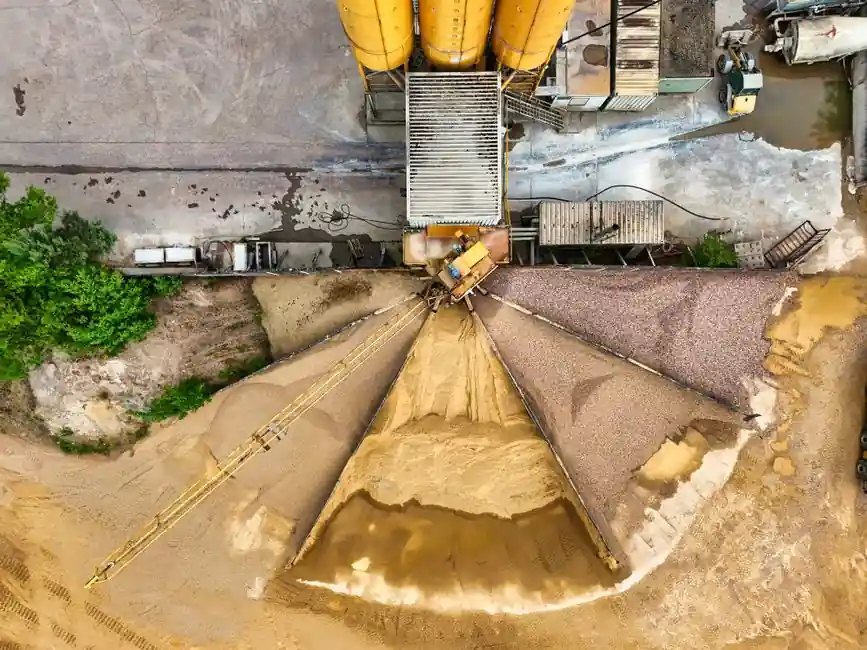
Domestic US capacity utilization is only running around 76%, which is well below the 80% that producers would like to see, according to a market news report on the US cement market outlook [S1].
Shipments of Portland, blended, and masonry cements totalled 114.1 million US short tons (about 104 Mt) in 2025, down 2% year-on-year and 18% below the 2005 peak, while net imports supplied 24% of US demand in 2025 versus 7% in 2012 [S5]. Global consumption reached 4.2 billion tons in 2024, valued at $410 billion and growing 5.2% annually since 2010, with the US demand of 103 million tons in 2024 forecast to grow 6% annually to 2031 [S2].
US: flat shipments, import dependence, and a sub-80% utilization ceiling
US cement shipments grew at a 1.0% CAGR from 103.1 million short tons in 2015 to 114.1 million short tons in 2025, and Texas alone consumed 18% of national volumes in 2025, with the top ten states accounting for 54% [S5].
Domestic capacity is structurally short: net cement and clinker imports reached 27 million short tons in 2025, up 1.5% year-on-year, filling a gap that producers closed only partly through 2022-2023 Ordinary Portland Cement to Portland Limestone Cement conversions, which added 10-15% capacity at converted plants [S5]. Argus reported on 2025-11-25 that capacity utilization is running at about 76%, against an 80% producer target, with import pressure compounding the imbalance [S1]. For procurement and EPC planners, this shows up as a continuing import-share floor near a quarter of supply, a baseline that constrains domestic cement pricing power and rewards buyers who maintain dual-source contracts across US Gulf terminals and Atlantic clinker corridors.
China: utilization below 50% and a 2026 demand decline, narrowing
By the end of September 2025, Chinese cement capacity utilization had dropped below 50%, intensifying the supply-demand imbalance, and SunSirs projected on 2026-01-13 that national cement demand will show a moderate decline in 2026, with the rate of decrease narrowing [S4].
In the first three quarters of 2025 only Tibet and Ningxia among China's 31 provinces recorded year-on-year output growth, while the Northeast, Northwest, East China, and North China regions posted declines steeper than the national average, reflecting the deeper real-estate drag relative to the infrastructure pull [S4]. The widening cement-coal price spread in 2025 gave a marginal lift to industry profitability, yet debt-financing scales continued to grow and debt-repayment indicators weakened, suggesting that 2026 will keep margins under pressure even as the 15th Five-Year Plan infrastructure pipeline provides a partial demand floor. For special cement and concrete specifiers, the sub-50% utilization reading is the signal to lock in annual volume commitments rather than rely on spot kiln capacity, since off-peak production mandates and dual-carbon controls are now formalized tools of supply-side discipline.
India: 30-40 Mt annual demand growth driving 160-170 Mt of new capacity
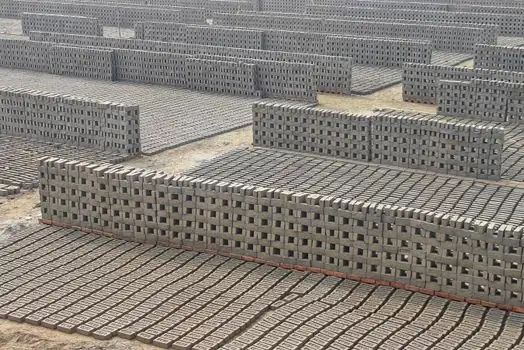
Over fiscals 2026-28, Indian cement makers are expected to see incremental demand of 30-40 million mt per year, prompting capacity additions of 160-170 million mt, per CRISIL via S&P Global Commodity Insights on 2025-11-12 [S3].
That ratio of demand-pull to capacity-build, roughly 0.5 t of new capacity per 1.0 t of incremental annual demand, is consistent with the historical Indian pattern of building ahead of the curve, and it is the single largest capacity expansion programme in any single national market through 2028. For clinker-import strategists, the Indian buildout matters because it pulls in petcoke and fly-ash supply chains and shifts regional trade flows away from the Middle East and toward Indian Ocean clinker trans-shipment hubs. The demand math also frames why the same fiscal window is seeing downstream pull on construction machinery and equipment, with concrete batching and ready-mix fleets scaling at roughly the same 6-8% annual clip as the underlying cement volumes.
Per-capita benchmarks: where the next 500 Mt sits
Global per-capita cement consumption averaged about 549 kg in 2020, while China sat at 1,700 kg per capita and the US at 310 kg per capita, a gap that frames the long-run convergence thesis behind most emerging-market demand models [S2].
The ASCE 2025 report card graded US bridges C and roads D+, and only 40% of the $1.2 trillion Infrastructure Investment and Jobs Act had been deployed as of September 2025, with about $500 billion earmarked for roads, bridges, and major projects, a pipeline that supports a multi-year US demand floor even as volumes stay 18% below the 2005 peak [S2][S5]. Public works (roads and bridges) consumed 43% of US cement demand in 2024, with non-residential construction at 19%, and bipartisan discussion of a follow-on Highway Bill would tilt the next funding tranche further toward cement and concrete intensive pavement and bridge work.
Cost structure and profitability: the cement-coal spread is the 2026 swing factor

Cement production cost splits roughly 30-40% energy, 20-25% raw materials, 20-25% freight and distribution, 15-25% maintenance and other operating expense, and 5-10% labour, with the mix shifting by region, kiln technology, and the regulatory environment per CemBureau data cited in the Gabelli 2025-10-23 industry note [S2].
SunSirs reported on 2026-01-13 that the cement-coal price spread widened modestly in 2025, yet operating performance stayed under pressure and bond-issuance volumes among Chinese cement issuers declined year-on-year from January to November 2025, with new issuers concentrated at the high-investment-grade end of the credit spectrum [S4]. For EPC cost engineers, the energy share of 30-40% means that a 10% move in coal or petcoke price flows through about 3-4 percentage points to total cash cost, which is why Indian and Southeast Asian buyers with captive waste-heat-recovery and alternative-fuel kilns will out-compete older wet-process plants on the export-led margin even when headline cement prices are flat. The same energy intensity is why lighting upgrades at cement plants carry paybacks inside 24 months in most tariffs, since kiln-floor and cooler-radiant loads are continuous and run six to eight thousand hours per year.
Selection guidance: matching sourcing strategy to regional utilization
For US buyers, prioritize dual-sourcing across domestic mills and Mexican or Vietnamese clinker terminals, since 24% import dependence is now structural and 76% utilization means domestic producers cannot surge supply on a 90-day cycle [S1][S5].
For European and African project EPCs, expect the Indian capacity wave to pull Indian Ocean clinker pricing down through 2027, favouring spot-tendered marine cement contracts over annual fixed-price frameworks, while Chinese cement is unlikely to be an export lever in 2026 because the sub-50% domestic utilization reading is being absorbed by off-peak-production policy rather than by overseas shipments [S3][S4]. The verification move on any of these decisions is the same: pull the USGS mineral commodity survey released April 2026 for the import-mix and net-import tonnage, layer the Argus utilization reading, and confirm with CRISIL on the Indian buildout before locking a 12-month volume commitment.
Track these three signals over the next two quarters: any move of US capacity utilization above 78% on the back of an IIJA disbursement acceleration; the first two CRISIL monthly prints on FY2026 Indian capacity commissioning; and the Chinese NBS cement output release for Q1 2026, where a print above 1.55 billion tons would mark the first sequential demand stabilization since 2022.
Related analysis: CTP and CTB battery pack designs: 2026 adoption snapshot.