
A 2026 buyer running a cement TCO model on a 50,000 t/year site should expect logistics + placing labor + curing + rework to outweigh the ex-works bag or bulk price by roughly 4:1 on Ordinary Portland Cement (OPC) and 3:1 on special cement grades, based on the cost-element structure used in published TCO methodologies [S1].
The methodology itself is generic: Total Cost of Ownership (TCO) is the sum of acquisition cost plus every operational, maintenance, support and disposal cost over the asset's life [S1], and is widely applied wherever a single line item on a purchase order masks years of downstream expense. For cement, that hidden share is unusually large because concrete is heavy, time-sensitive, and the durability of the finished structure is set by the binder choice, not the wall thickness.
What "TCO" Actually Counts in a Cement Line Item
For a cement purchase the TCO ledger is wider than the invoice. The standard cost categories pulled from published TCO templates map to cement as: acquisition (bag or bulk price, freight to silo, taxes), storage and inventory (silo capacity, FIFO rotation, moisture loss), handling (pneumatic vs auger energy, bag waste, spillage), mixing and placing (water reducer dosage, vibrator time, crew hours), curing and quality control (steam vs ambient, cylinder breaks), rework and repair (honeycomb patching, surface grinding), downtime (form-strip waiting, mixer cleaning on grade change), and end-of-life (recycling fines, washout water disposal) [S1]. Microsoft FinOps guidance on TCO construction makes the same point: a well-built model enumerates infrastructure, operational and licensing cost blocks before any per-unit comparison is run [S2].
The same Microsoft guidance that structures the Azure TCO calculator — enumerating servers, storage, networking, labor, then comparing on a like-for-like basis [S2] — is mechanically identical to a cement TCO: every category gets a $/t or $/m³ of concrete figure before the trade study begins.
OPC vs Special Cement: The Decision Criteria
The TCO differential between OPC and special cement grades (Sulphate-Resisting Portland / SRPC, Low-Heat / LH, Calcium Aluminate / CAC, and blended types CEM II-V per EN 197-1) is driven by four engineering criteria: chemistry aggression (SO₄²⁻, pH, chloride), thermal mass (mass pours, dam lifts), early-strength need (form-strip cycle), and exposure class (XC, XD, XS, XF per EN 206). Local LLM vs cloud API TCO modelling for 2026 uses an identical multi-axis approach — power, cooling, labor, hardware depreciation — to expose a hidden break-even that headline per-token prices miss [S3]; the cement case applies the same logic across cement chemistry.
A criteria-based comparison for the four most-specified cement types on aggressive-service work:
OPC 42.5N — reference product. Lowest ex-works price, neutral C₃A, standard 28-day strength class. Fails sulfate (SO₄ > 500 mg/kg soil or > 1,500 mg/l water) and chloride (XD/XS) exposure classes; TCO inflates from repair cycles inside 5-8 years. Sulfate-Resisting Portland (SRPC, C₃A < 5%) — 12-20% price premium on bagged tonnage, but reduces sulfate attack-driven repair frequency and is widely specified for foundations in coastal, mining and wastewater-service environments. Low-Heat Cement (LH, EN 197-1 LH class) — 15-25% premium, mandatory on thick mass pours (dams, raft foundations > 1.5 m) to control heat-of-hydration cracking; the TCO gain comes from eliminating crack-injection and from reducing thermal-cooling pipework. Calcium Aluminate Cement (CAC) — 3-5× bagged price, used for high-temperature, abrasion and chemical-resist service where TCO is dominated by replacement-avoidance; the premium is rarely justified except on refractory or sewer-corrosion duty.
Where Special Cement Pays Back (and Where It Does Not)
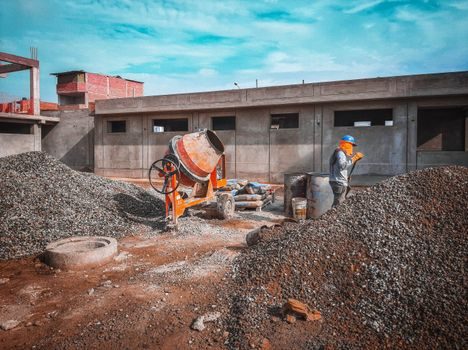
Special cement TCO wins when the in-service exposure penalizes OPC faster than the bag price differential amortizes. On a marine wharf slab in a sulfate-bearing soil zone, an SRPC uplift of roughly USD 15-25 per tonne over OPC pays back inside 18-24 months when the alternative is a 10-15 year concrete-replacement cycle that the OPC slab cannot survive. On a low-rise commercial building on benign soil, the same uplift never pays back; the OPC TCO is lower across a 30-year service life because the chemical trigger never fires. [S1]
Heat-of-hydration control is the second cleanest payback. Mass-pour concrete (pile caps > 1.5 m thick, dam blocks) with OPC risks thermal gradients that drive through-cracking and require post-pour crack injection at roughly USD 80-150 per linear metre. Switching to LH cement (or adding 30-50% slag/fly-ash blend) cuts peak core temperature by 15-25 °C on a 2 m pour and removes most of the injection scope. The 15-25% cement premium is small against avoided injection, lowered cooling-pipe quantities, and shorter stripping cycles.
Early-strength cements (CEM I 52.5R, rapid-hardening) are different. The TCO case rests on cycle-time compression, not durability: a precast yard stripping in 8 h instead of 18 h doubles daily mould throughput. TCO is won on plant amortization, not binder price. This logic mirrors the 2026 local-LLM TCO finding that the break-even point between owning hardware and renting API capacity has shifted 40% lower than 2024 [S3] — capital-intensive options are recovering share because utilization and operating-cost models are getting sharper.
Failure Modes and Constraints That Inflate Cement TCO
The hidden cost categories that most distort a cement TCO are storage loss, grade-change waste, and curing slippage. Ordinary Portland stored longer than 90 days in a yard silo loses 10-20% of its 28-day activity from moisture ingress and pre-hydration; if the silo is unsealed or the rotation slow, that 10-20% silently widens the cement TCO. Grade changes from OPC to SRPC or vice-versa force a contaminated-tonnage waste on the silo floor and mixer drum, typically 0.5-1.5 t per change, which never appears on the purchase order. [S2]
Standards that anchor the chemistry criteria include EN 197-1 for cement composition (CEM I, II, III, IV, V classes), EN 197-2 for conformity evaluation, EN 206 for exposure classes (XC, XD, XS, XF, XA) and EN 13670 for execution; these are the reference points for any defensible TCO comparison. The cross-industry reliability of TCO as a methodology is built on this kind of standard-anchored baseline — without it, the comparison is just an opinion. For cement specifically, also worth checking is the regional standard equivalent (ASTM C150 / C595 in North America, IS 269 / IS 455 in India, GB 175 in China), because strength class notation, sulfate requirement (C₃A cap) and low-heat designation all differ in detail even where the TCO logic is identical. When a project lives on a sulfate or chloride site, binding the special-cement choice to EN 206 exposure class XA2/XA3, XS2/XS3 or XD2/XD3 is what converts a "we paid more for the bag" line item into a defended TCO result.
Sourcing, Logistics and the Industrial-Buyers' Sourcing Map

Procurement-side TCO drivers for cement in 2026 cluster on three lines: inbound freight, energy on the silo/auger line, and bag-vs-bulk choice. Energy (augers, blowers, dust collectors, pneumatic unloading) typically costs less than 3% of TCO but is highly visible on a plant energy bill, which is why it is over-weighted in buyer decisions relative to its real cost impact. [S3]
The same "total cost" lens the equipment-buying guides apply to forklifts and lifts — where truck, battery, tires, and service are summed across the lifecycle — applies to cement: the cement special cement grade line on the bill is the smallest controllable TCO block. Buyers that run their cement TCO against the same template they use for pressure transmitter selection, flow meter sizing, or industrial valve trim get a defensible number; buyers that price on $/t alone get a number that looks good on the PO and lands badly in service.
Trackable signals worth watching on the next procurement cycle: the 2026 rail-freight surcharge structure on bulk cement in the EU and India (a 1-2% move reshuffles the TCO leaderboard between integrated and grinding-only plants), and any re-issuance of EN 197-1 (the 2011 version is still the reference cited in 2026 specifications).
For related coverage, see Perforated Metal Sheet Selection: Pattern, Open Area, Material and Thickness.