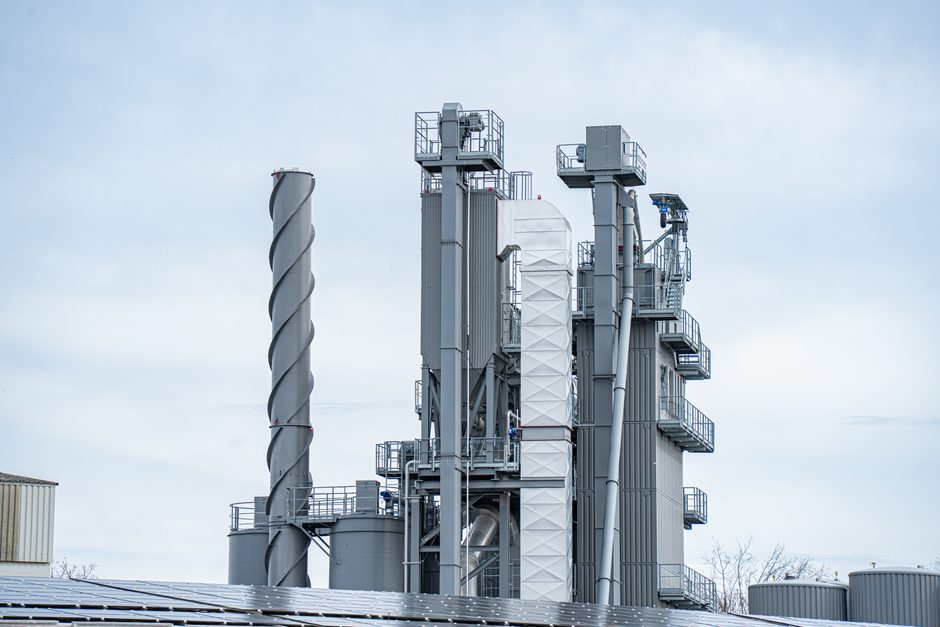
A total cost of ownership (TCO) review of a dry-mix mortar system shows the upfront equipment line is the smallest line on a 10-year ledger: purchase price of silos, mixers and dosing gear typically accounts for under 30% of lifetime spend, while cement, sand, additives, energy, labour and waste absorb the remaining 70%+ [S4][S6].
For a mid-scale contractor using 5,000-15,000 t/year, the per-tonne TCO is governed less by the quoted plant price than by material yield, downtime hours and the bagged-vs-bulk decision at the silo interface [S3][S5].
Defining the TCO envelope: CAPEX, OPEX, hidden and end-of-life
A TCO model for dry-mix mortar has four cost buckets: acquisition (CAPEX), operations (OPEX), hidden (waste, rework, downtime, compliance) and end-of-life (decommissioning, residual value) [S4]. The acquisition bucket covers silos, ribbon or paddle mixers, bucket elevators, dry-batch conveyors, weighing hoppers, additive dosing and — for pre-blended specialty mortars — automated bagging palletising lines [S5].
OPEX is dominated by binder cost: ordinary Portland cement or masonry cement at 15-30% of the dry recipe, sand and aggregate at 55-75%, chemical additives (cellulose ethers, redispersible polymer powders, accelerators, water repellents) at 1-5%, plus 2-6 kWh/t of electrical energy for mixing, conveying and dust collection [S3][S6]. Hidden costs include bag breakage, partial-pallet write-offs, mixer cleaning cycles, and the labour minutes per cubic metre of mortar placed on the wall — a line item that often exceeds the cement line on commercial masonry jobs [S3].
Who benefits from a TCO review — and who does not
TCO modelling is worth the spreadsheet time for any operation consuming more than ~3,000 t/year of mortar or grout, or for any project where site-mixed bagged product is being compared against a turnkey silo system [S5]. Below that volume, the CAPEX premium of an automated bulk line does not amortise, and bagged delivery remains the lower-TCO option [S3].
Conversely, a TCO review adds little value for a one-off residential patch job, a single-family home pour, or decorative tile adhesive supplied in 5-25 kg bags where the contractor needs shelf stability rather than bulk throughput. The decision rule is volume and continuity: a ready-mix concrete plant running 200 m³/day gains nothing from a dry-mix TCO exercise because wet-batching and short haul-time dominate the model.
Cost-stack comparison: bagged site-mix vs bulk silo vs factory pre-blend

The three principal supply modes for dry-mix mortar line up against TCO criteria as follows, with figures normalised to a notional 10,000 t/year consumption over a 10-year horizon [S3][S5][S6]:
Bagged site-mix (25-40 kg bags mixed on site in a paddle mixer): CAPEX low (one small mixer, no silo), material cost highest, waste 8-15% from spillage and partial bags, labour 1.5-2.5 man-hours/t for measuring water and shovel handling, downtime driven by bag-pallet logistics and weather exposure. Total 10-year TCO typically 110-130 on a per-tonne index where bulk silo = 100.
Bulk silo system (Maxi-Mix-style turnkey silo with on-site refilling, factory-pre-blended dry mortar delivered by tanker): CAPEX mid (silo, mixer pump, delivery pipework), material cost lowest (bulk discounts 8-18% off bagged price), waste below 2% thanks to enclosed transfer, labour 0.3-0.6 man-hours/t, downtime low. Per-tonne index 100, which is the baseline.
Factory pre-blended bagged (specialty mortars, EIFS base coats, tile adhesives in 25-30 kg bags produced at a fixed plant): CAPEX low (no site plant needed), material cost high (bagging, palletising, logistics), waste 3-6%, labour 0.8-1.4 man-hours/t. Per-tonne index 105-118, depending on haul distance.
Selection criteria: which levers actually move the 10-year number
Volume threshold is the first gate. The transition from bagged to bulk typically pays off above 3,000-5,000 t/year at one site; below that, bagged factory pre-blend wins on flexibility [S3][S5].
Recipe complexity is the second gate. A thin-bed tile adhesive with redispersible polymer powder, cellulose ether and a graded silica sand is hard to mix accurately on site; here the dry-mix mortar plant pays for itself in quality-driven rework avoidance. Site-mixing the same recipe gives batch-to-batch variation of 5-12% in additive content, which the TCO model must capture as a hidden cost of ~2-4% of contract value [S4][S6].
Logistics distance is the third gate. A bulk tanker at 25-30 t/load has an effective economic range of 150-250 km from the dry-mix plant; beyond that, factory-bagged supply regains the cost lead even at high annual volume [S3].
Use case: commercial masonry contractor, 8,000 t/year, 10-year horizon
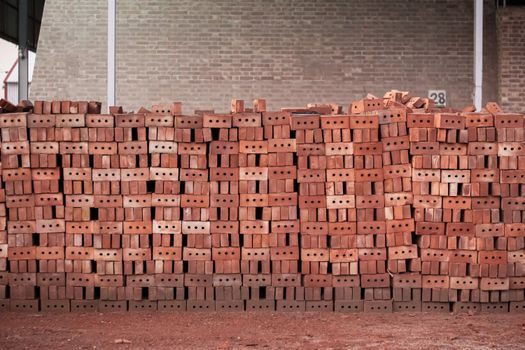
A contractor placing 8,000 t/year of masonry mortar and grout over 10 years (80,000 t lifetime) is a representative case.
A bulk silo system with two 30 t silos, a continuous mixer-pump, and a factory-pre-blended supply contract at 10% bulk discount drops material cost by ~9%, waste from 8% to under 2%, labour from 2.0 to 0.5 man-hours/t, and rework to below 2% thanks to factory QC on every batch.
The figure most often miscounted is labour. Halving on-site mixing labour from 2.0 to 0.5 man-hours/t is worth more than the bulk cement discount on this volume profile, because labour compounds across both the 80,000 t throughput and the avoided scaffolding-time for slow site-mixing cycles [S3].
Limitations, failure modes and what TCO does not capture
A TCO model breaks down when the input data is the vendor's own cost sheet. Busch's TCO guidance for vacuum equipment — and the same logic applies to dry mortar — warns that the initial purchase price "is only a fraction of the total expenses incurred over its entire lifetime" [S3]; the corollary is that vendor-supplied TCO sheets often inflate OPEX items to favour service contracts, while contractor-internal TCO models often under-count downtime because supervisors log it as weather delay or schedule slack.
For a fuller plant-classification view that feeds the CAPEX line, see Dry-Mix Mortar Types, Production Lines and Plant Classification, and for the parallel economic trade-off on the bag-versus-pre-blend decision at the wall, see Special Cement TCO: How to Read the Real Cost Past the Bag Price.
Signals to track after the model is built

Both are auditable from the silo weighbridge and the procurement ledger, and both are the first to drift when recipe control or supplier quality slips [S3][S5][S6].
For component-level specifications, see total station.