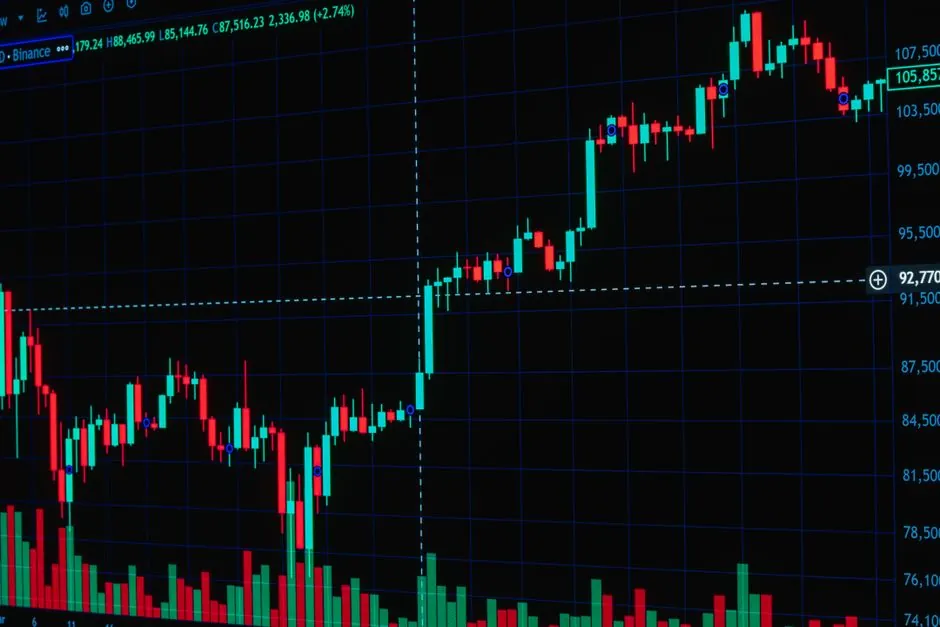
Dysprosium oxide traded at $2,166.15/kg on 22 October 2026, while terbium oxide ran at roughly 4.6x the dysprosium price in early 2026 reporting, putting both heavy rare earth oxides far above the U.S. government price floor of $110/kg set for neodymium-praseodymium [S4][S5][S6]. Year-to-date through 22 October 2026, dysprosium is up 377.23%, a swing that dwarfs anything visible in the NdPr tape.
The volatility gap is not new, it is structural. From 2021 through 2024, terbium oxide went from $1,340/kg average to $2,050/kg in 2022, then fell roughly 60% to $812/kg by 2024, a 2.5x peak-to-trough range inside three years [S2]. Dysprosium moved from a 2024 annual print down 39.89% to a 2026 YTD gain of 377.23%, meaning the same oxide booked losses one year and quadruple-digit-style gains the next [S5]. NdPr, by contrast, is described as the "meat and potatoes" workhorse of the magnet basket, with far more diversified supply and steadier quotations [S3].
Price levels: how big the DyTb premium actually is on 2026-10-23
On the U.S. price-floor schedule published 29 May 2026, NdPr oxide is anchored at $110/kg, terbium at $2,050/kg, and dysprosium at $575/kg, a roughly 18.6x and 5.2x premium for Tb and Dy over NdPr at the floor [S4]. Spot quotes in late October 2026 are well above the floor: dysprosium at $2,166.15/kg [S5] and terbium trading at about 4.6x the per-kg price of dysprosium in March 2026 reporting, which would put terbium near $9,960/kg if that ratio held to the October dysprosium print [S6].
For comparison, the Q3 2026 Benchmark review puts ex-China dysprosium oxide CIF Europe at an average of $3,500/kg for the quarter, a 56% gain, with ex-China terbium and yttrium up 150% by quarter-end [S7]. The implication is that a buyer who tries to source DyTb outside the Chinese customs perimeter in Q4 2026 is paying materially more than the floor schedule, and far more than the NdPr reference.
Volatility: one-year, three-year, and peak-to-trough swings
Dysprosium's multi-year track record captures the asymmetry cleanly. The oxide fell 15.10% in 2022, fell 10.10% in 2023, and fell 39.89% in 2024, then rebounded 28.55% in 2025 and added 377.23% YTD through 22 October 2026 [S5]. The four-year drawdown totaled roughly 55% peak-to-trough from 2022 to 2024, and the 2025-2026 rally has more than undone that and then some, with the oxide now 513.47% above its 1 January 2025 starting point [S5].
Terbium shows the same shape, with sharper amplitude. A roughly 60% decline from the 2022 average of $2,050/kg to a 2024 average of $812/kg is the down-leg [S2], and Q3 2026 alone delivered a 150% surge in ex-China terbium pricing [S7]. Fastmarkets flags terbium specifically as "one of the least transparent and most volatile rare earth products" because it is traded in smaller lot sizes than dysprosium and therefore has thinner liquidity [S1].
Why DyTb is more volatile than NdPr: geological and market-structure drivers
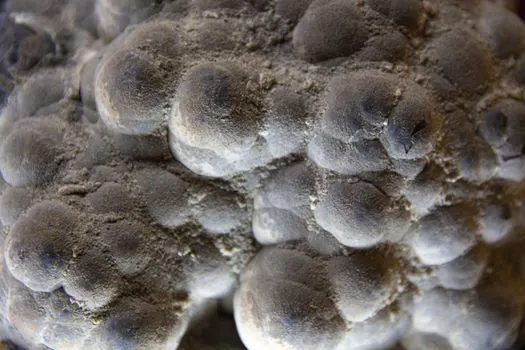
The volatility premium is grounded in geology. In a standard hard-rock rare earth deposit such as monazite or bastnaesite, roughly 98% to 99% of recovered rare earths are "lights" (Ce, La, NdPr), with the heavies including dysprosium and terbium often under 1% of the basket [S3]. That supply ratio is the floor on DyTb's structural scarcity premium relative to NdPr.
Market structure amplifies it. Heavy rare earths are sourced overwhelmingly from ionic adsorption clays historically found in southern China and Myanmar, and these clays deliver a much higher DyTb ratio than hard-rock ore but at a lower overall grade [S3]. With ex-China heavy REE supply still thin, spot prices can move 56% in a single quarter, as Benchmark recorded for dysprosium oxide CIF Europe in Q3 2026 [S7]. NdPr, by contrast, can be sourced from multiple hard-rock mines outside China and from recycled swarf, which dampens the spot response.
Use-case fit: who absorbs DyTb volatility, and who does not need to
DyTb is dosed at 1% to 10% by weight into high-performance NdFeB magnets to stop demagnetization above roughly 80°C, which is the operating range for EV traction motors, wind turbine generators, and defense guidance systems [S3]. A procurement manager specifying magnets for a 200°C-rated motor has no substitute for Dy or Tb in the magnet grain boundary, so DyTb price risk flows directly into the magnet line item.
By contrast, an NdPr-only spec (no high-temperature duty, no defense thermal margin) is exposed mainly to NdPr pricing and is largely insulated from DyTb's 377%-YTD-style moves. A buyer of consumer-grade NdFeB magnets rated to 80°C, or a non-magnet NdPr user such as a glass polisher, can treat DyTb as a non-issue on the bill of materials. The decision criterion is the magnet's maximum operating temperature versus 80°C, not the absolute DyTb price.
Comparison matrix: DyTb vs NdPr on the metrics that matter for procurement

Side by side on four criteria visible in the 2026 data: price level, one-year swing, drawdown depth, and supply concentration. [S3]
Price level: NdPr at the U.S. floor of $110/kg [S4]; dysprosium oxide at $2,166.15/kg on 22 October 2026 [S5]; terbium oxide estimated near $9,960/kg if the 4.6x dysprosium ratio from March 2026 holds [S6]. One-year swing: NdPr has no comparable triple-digit YTD move in the available data, dysprosium is +377.23% YTD [S5], terbium is up 150% in Q3 2026 alone [S7]. Drawdown depth: terbium fell roughly 60% from 2022 to 2024 [S2], dysprosium fell 39.89% in 2024 alone [S5], NdPr drawdowns in the same window are not flagged as comparable in magnitude. Supply concentration: NdPr is sourced from multiple hard-rock operations globally; DyTb is still anchored to ionic adsorption clays in southern China and Myanmar, with ex-China supply thin enough to push CIF Europe dysprosium to $3,500/kg average in Q3 2026 [S3][S7].
Limitations and failure modes of the data
The figures cited are not perfectly comparable. The U.S. price-floor schedule is a policy anchor, not a live spot print, so the 18.6x Tb-to-NdPr ratio at the floor overstates the premium that a buyer actually pays today [S4]. The 4.6x Tb-to-Dy ratio is from March 2026 reporting and may not hold into Q4 [S6]. The Strategic Metals Invest dysprosium print is a retail-aligned quote dated 22 October 2026, while Benchmark's $3,500/kg Q3 average is a CIF Europe industrial assessment, so the two numbers should not be averaged or treated as the same market [S5][S7].
For procurement, the takeaway is to anchor on a single published assessment (Argus, Fastmarkets, or Benchmark) rather than mix sources. The Argus June 2024 monthly, for reference, printed dysprosium oxide at $270-290/kg CIF Europe and terbium oxide at $840-890/kg CIF on 4 June 2024, a baseline that shows how far both oxides have moved in roughly 28 months [S8].
Sourcing and standards notes for spec writers
There is no ISO or ASTM material standard that pins a specific DyTb price or a DyTb-to-NdPr ratio, so any cost model on a magnet drawing has to declare its assessment source and its date stamp. Fastmarkets, Argus, and Benchmark are the three Western assessments that publish ex-China dysprosium and terbium oxide ranges; USGS publishes annual averages that lag the spot tape by months [S1][S8].
On the magnet side, the relevant specifications are the magnet grade (N35SH through N54SH and equivalents) and the maximum operating temperature, which is the variable that determines whether Dy or Tb is needed at all. A spec that says "NdFeB, high temp" without naming a grade or a temperature ceiling is not a DyTb cost model, it is a guess.
Trackable signals to watch into Q4 2026: the next Benchmark quarterly review for whether the Q3 150% ex-China heavy REE surge holds or mean-reverts [S7], any update to the U.S. price-floor schedule beyond the 29 May 2026 publication [S4], and the first ex-China ionic clay production guidance from non-Chinese developers, which would be the first structural relief on the DyTb supply ratio [S3].