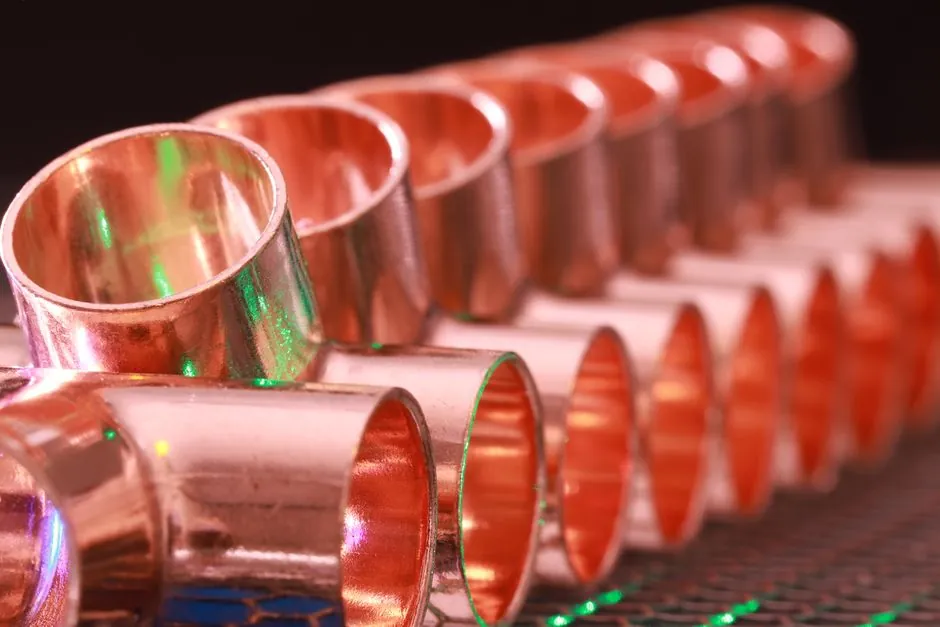
LME three-month copper touched an intraday $14,527.50/t on 29 January 2026, the largest single-day rise since 2008, and the market has held above $14,000/t into October, with LME cash above $14,850/t and the three-month near $14,315/t in late August [S2][S9].
Underneath that price action, the International Copper Study Group (ICSG) has flipped its 2026 view twice: October 2025 called a 150 kt deficit, the April 2026 update revised that to a 96 kt surplus, and the January–July 2026 cumulative balance ran +32 kt according to ICSG data cited by Simon Hunt [S4][S5]. The world refined market is roughly 27 Mt, with secondary (scrap) refined output at 4.7 Mt and growing about 5.7% in 2026 [S5].
Supply side: mine growth cut to 1.6% after a year of accidents
ICSG cut 2026 mine-supply growth to 1.6% from 2.3% following disruptions at Freeport-McMoRan's Grasberg district in Indonesia, Ivanhoe's Kamoa-Kakula in the DRC, and Codelco's El Teniente in Chile [S1][S5]. The Grasberg mud rush on 8 September 2025 held the district to 1.0 billion lb for the year, against roughly 1.7 billion lb at normal rates; El Teniente lost an estimated 48 kt of 2025 output after a seismic event on 31 July 2025; Kamoa-Kakula halted for three weeks after May 2025 seismic flooding [S2].
Glencore shut the underground Mount Isa copper mine in Queensland in July 2025 after more than sixty years of operation, and the ICSG tally for full-year 2025 mine output growth was just 0.9% [S2]. In Q1 2026, Indonesian concentrate output fell roughly 42% year on year and Chilean mine production dropped about 5.8%, while growth leaned on a handful of ramp-ups: Oyu Tolgoi underground, Malmyz, Julong, Almalyk, and stockpiled ore processed at Cobre Panamá [S5]. Chile alone accounts for about 24% of world mine output, leaving the supply base unusually concentrated and exposed to single-asset shocks.
Refining: concentrate is the binding constraint, smelters paid to take feed
The clearest scarcity signal is not in the LME quote but in the treatment and refining charge (TC/RC) that miners pay smelters. In December 2025, Antofagasta and an unnamed Chinese smelter agreed 2026 annual terms of $0/t and 0.0¢/lb, versus $21.25/t and 2.125¢/lb for 2025, which the IEA calls the lowest level ever agreed in annual negotiations [S1][S2]. Spot charges went negative well before that: Shanghai Metals Market put them at minus $42.32/t on 21 November 2025, meaning a smelter was paying for the privilege of being fed concentrate.
ICSG expects world refined production to rise only 0.4% in 2026 before accelerating to about 3% in 2027; primary electrolytic output is capped by feed availability, and SX-EW plus secondary refined take up the slack [S5]. The geography is lopsided: China refines roughly 51% of world smelter production and 45% of refined production, yet mines only about an eighth of what it smelts, and in Q1 2026 China plus the DRC together grew refined output about 9% while Chilean refined output fell 11.7%.
Demand: grids, EVs, and AI data centres pull structural demand higher
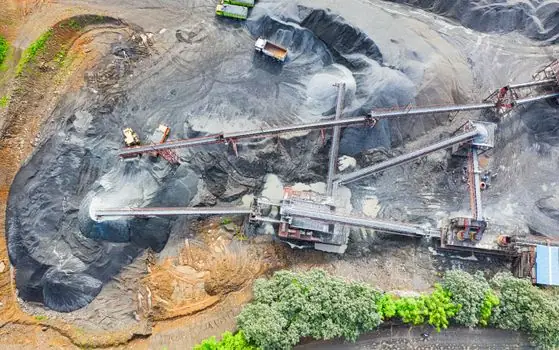
Electricity grids and power infrastructure are projected to drive more than 60% of copper demand growth to 2030, the equivalent of adding another United States of consumption, while BloombergNEF expects data centres to absorb an average 400 kt of copper per year from 2026 through 2035, peaking at 572 kt in 2028 [S2][S3]. J.P. Morgan pegs 2026 data-centre copper demand at roughly 475 kt; a single large AI facility can require up to 50,000 tonnes for wiring, cooling and power distribution [S3].
Fastmarkets counts more than $300 billion committed to China's power grid over the past four years, with another $80–100 billion earmarked for 2025 alone, and the IEA's Stated Policies Scenario has clean-technology copper demand climbing from 7,737 kt in 2024 to 12,162 kt by 2040 [S2]. The Chinese side of the demand ledger matters most for price: Shanghai Futures Exchange stocks fell from 2,146 kt in January 2026 to just 56 kt by mid-September, and China is the marginal buyer that sets the world price [S4].
Compared with 2025: which signals are tighter, which are looser
On the tight side: LME cash above $14,500/t against an average range of roughly $8,500–$9,700/t the year prior, 2026 TC/RCs of $0/t and 0.0¢/lb versus $21.25/t and 2.125¢/lb for 2025, and a SHFE warehouse drawdown from 2,146 kt to 56 kt inside nine months [S2][S4]. The IEA labels the December 2025 TC/RC settlement "the lowest level ever agreed in annual negotiations" [S1].
On the loose side: world refined market in +32 kt surplus in January–July 2026, after a 157 kt surplus in the same period of 2025; ICSG forecast swung from a 150 kt deficit (October 2025) to a 96 kt surplus (April 2026) and a projected 377 kt surplus for 2027; Q1 2026 apparent surplus reached 396 kt versus 135 kt a year earlier; and global mine output growth of just 0.9% in 2025, while soft, was followed by 1.6% projected for 2026 rather than a contraction [S2][S4][S5]. Excluding China, the rest of the world ran a 200 kt surplus through July 2026, and refined consumption outside China grew only 0.8% [S4].
What the 2026 reading means for spec-driven buyers

For procurement teams buying copper material under annual contracts, the 2026 print means higher headline cost plus a deeper split between physical availability and price. Cathode and billet are obtainable; concentrate is not, and that is what the $0/t TC/RC is signalling, not cathode scarcity [S1][S2]. The single largest short-term price risk is the Chinese restocking cycle, since SHFE stocks at 56 kt leave the marginal tonne in Chinese hands and the rest of the world sitting on a surplus [S4].
Demand-side substitution is already under way and is missing from most deficit models: photonics replacing copper wiring in data centres, solid-state transformers displacing conventional copper-wound units, and aluminium being substituted into low-voltage underground cable, with China having installed at least 14 million tonnes of copper in LV underground power cable since 1980 and beginning to switch to aluminium as a domestic resource [S4]. The EU has installed around 6.5 million tonnes of copper in its LV underground grids between 1970 and 2026, and roughly half of the EU's 2.975 million tonnes of annual scrap flow will return as that cable is replaced [S4].
Forecast split and the key watch items for 2027
The forecast band is unusually wide: Goldman Sachs targets $11,200/t by Q4 2026 with fair value near $11,500/t, modelling a 15% US refined-copper tariff, while JPMorgan and Cochilco sit in the $11,000–$11,500/t range; LME cash was $13,795/t on 30 July 2026 with LME stocks at 255,400 t, roughly 25% above late-November 2025 levels [S6]. A separate December 2025 Goldman note modelled LME copper in a $10,000–$11,000/t range for 2026 and $15,000/t by 2035 [S2]. ICSG itself expects 2027 to widen the surplus to 377 kt, with mine growth rebounding to 2.3% on recovery in Chile, Zambia, Indonesia and the DRC [S5].
Trackable signals for the next quarter: ICSG's October 2026 statistical bulletin for the full nine-month balance, SHFE warehouse stocks relative to the 56 kt mid-September low, LME cash–three-month spread (a $535/t cash premium was implied in late August), and the next round of annual TC/RC negotiations for 2027, which will reset the smelter signal [S4][S5][S9]. Also watch Section 232 outcome language on refined copper tariffs, since a 15% US tariff assumption sits inside the Goldman fair value and the COMEX–LME basis has already decoupled from its pre-2025 1% spread [S2][S6].