
End-of-line (EOL) test data analytics treats every shipped unit as a structured data record, then applies statistical process control and machine learning across those records to surface yield loss, station drift, and bin-pattern shifts before they reach the customer [S2][S3].
The practice has moved from a back-office Six Sigma exercise to a real-time production discipline, driven by tighter tolerances, higher unit volumes, and the need to isolate affected lots in hours rather than weeks when a field issue emerges [S2][S4].
Defining EOL Test Data and the Per-Unit Traceability Requirement
EOL test data is the complete measurement record generated when a fully assembled unit passes through functional, electrical, mechanical, thermal, acoustic, and safety verification before shipment, paired with a unique product identifier (serial number, lot code, or work order) so every reading is traceable back to a specific build [S2][S3].
The data set typically includes raw sensor waveforms, pass/fail flags per test step, cycle time, station ID, operator ID, environmental conditions, and the bill-of-material revision active at the moment of test [S2]. In semiconductor back-end, the equivalent baseline format is Standard Test Data Format (STDF) files produced by automated test equipment (ATE), historically batched at wafer or lot completion before being uploaded for analysis [S5].
Without per-unit traceability, downstream analytics cannot link a field failure to a specific build window, a specific test station, or a specific component lot, and the EOL gate degrades into a pass/fail filter with no feedback loop [S2][S4].
What "Yield" Means in an EOL Analytics Context
First-pass yield (FPY), sometimes called first-time-through (FTT), is the share of units that pass every EOL test on the first attempt without rework, and it is the primary yield KPI that EOL analytics is designed to protect and improve [S1][S8].
A second KPI, rolled throughput yield (RTY), multiplies the yields of every individual process step; if any step in a 10-step flow has 95% yield, RTY collapses to 60% even when each step looks acceptable in isolation, which is exactly the pattern EOL analytics is built to expose [S1][S9].
Third, test escape rate, the fraction of units that pass EOL but fail in the field, is a lagging indicator fed back through warranty and RMA data, and it is the metric that justifies EOL analytics spending in regulated industries such as medical devices and automotive electronics [S1][S4].
Selection Criteria for an EOL Analytics Stack
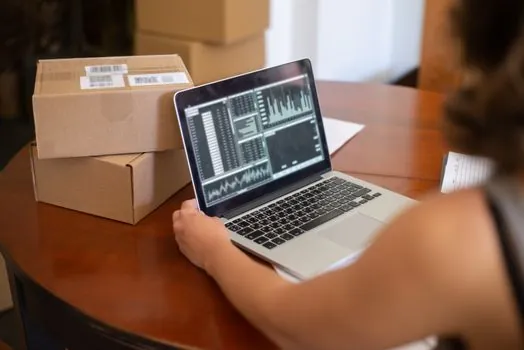
Five criteria separate a working EOL analytics deployment from a dashboard graveyard: data granularity, latency to insight, model transparency, integration with MES/historian, and closed-loop actionability [S2][S9].
Data granularity: every test step must be logged with timestamp, station ID, and unit serial, not just a binary pass/fail, because root-cause analysis depends on sub-test level visibility [S2][S4]. Latency to insight: traditional STDF workflows batch files at lot completion, which can mean 12 to 48 hours between test and analysis, too slow to catch a drifting station; real-time streaming cuts that window to minutes [S5]. Model transparency: SPC charts and control limits are auditable by a process engineer, while black-box neural predictions are not, and regulated industries require the former [S2][S9]. Integration: the analytics layer must read from MES, historian, and ATE logs through open interfaces, because siloed data defeats the purpose of collection [S2][S5]. Closed-loop action: the system must trigger a defined response (stop-the-line, quarantine, retest, or engineering review) rather than only display charts [S2][S9].
A practical buy-or-build decision turns on data volume and regulation: high-volume, regulated lines (automotive EOL, medical device EOL, semiconductor final test) typically justify dedicated platforms such as those from Synopsys/Advantest, Siemens, or PTC; lower-volume operations can start with SPC modules inside the existing MES [S5][S8].
Comparison of Core EOL Analytics Approaches
Four approaches dominate current deployments, each with a different cost, latency, and skill profile. [S2]
SPC on critical-to-quality (CTQ) parameters: Shewhart control charts, Western Electric rules, and Cpk monitoring on the measurements that matter to function and safety. Strength: auditable, low cost, regulator-friendly. Weakness: only catches parametric drift, not pattern-based defects [S2].
Bin-pattern and Pareto analytics on pass/fail: ranking the most frequent failure modes by station, shift, supplier lot, or shift, then driving targeted corrective action. Strength: immediate ROI on the top 3 to 5 failure modes. Weakness: requires clean failure-code taxonomies upstream [S1][S8].
Streaming ML anomaly detection on tester telemetry: models trained on nominal waveforms (vibration, current, acoustic emission, hipot leakage current) flag units that deviate from the learned envelope even when every individual parameter reads "in spec". Strength: catches intermittent and pattern-based defects that SPC misses. Weakness: model drift, explainability burden [S3][S5].
Predictive quality (shift-left) models: instead of waiting for EOL, models trained on in-process signals (torque, weld current, vision features) predict EOL outcome earlier in the line, allowing rework before value-add. Strength: lowest cost-of-poor-quality. Weakness: requires labelled in-process data and a change-management culture [S1][S6][S9].
A typical mature deployment runs SPC and Pareto as the baseline, layers ML anomaly detection on the highest-volume lines, and pilots predictive quality where the business case is strongest, usually on safety-critical sub-assemblies [S1][S3][S8].
Real Use Cases and Documented Results
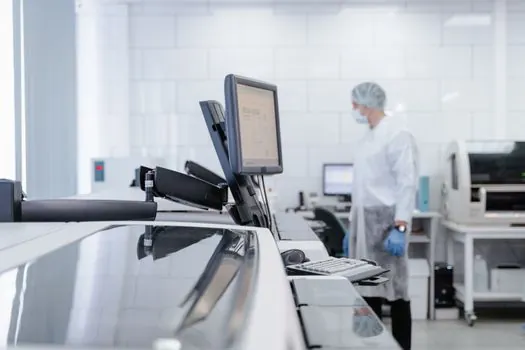
Automotive EOL: Acerta's predictive-quality work with tier-1 suppliers has shown that catching defects upstream of EOL, rather than at the final gate, reduces scrap, rework, and end-of-line test cost simultaneously, because EOL is itself a production bottleneck when every unit must be tested [S1][S6].
Semiconductor final test: the Synopsys/Advantest collaboration streams ATE data in real time so chipmakers can identify and fix issues before affected dies progress downstream, materially reducing retest volume and test cost compared with the legacy STDF-batch workflow [S5].
General discrete manufacturing: Sciemetric's intelligent test systems report that manufacturers using their analytics stack achieve measurable gains in first-time yield and defect reduction by linking test results to process signatures rather than treating EOL as a standalone gate [S8].
Process industry (chemicals, food, pharma): a semi-supervised learning framework published in Processes (MDPI, 2020) demonstrated that combining labelled defect data with large volumes of unlabelled EOL measurements improves defect prediction accuracy and yield compared with supervised-only baselines, a pattern now common across continuous-process EOL deployments [S7].
Instrumentation, Standards, and Data Plumbing
Modern EOL stations pull measurements from a heterogeneous instrument mix: digital multimeters for continuity and resistance, DC power supplies for stimulus, electronic loads for output verification, hipot/insulation testers for dielectric withstand, pressure-decay instruments for leak testing, and multi-axis data loggers for thermal and vibration profiles [S2][S3][S4].
Connectivity to those instruments increasingly rides on standard digital interfaces (Ethernet, EtherCAT, OPC UA, MQTT) so that the same measurement stream feeds both the pass/fail decision and the analytics lake, eliminating the parallel manual-log problem that breaks traceability [S2][S5].
Functional test coverage, not instrument choice, is the dominant driver of escape rate: dielectric withstand, ground-bond, and leak tests must match the regulatory regime (IEC 60601-1 for medical, ISO 26262 for automotive functional safety, IEC 61010 for test equipment itself) before the analytics layer can be evaluated on its own merits [S2].
Limits, Failure Modes, and What EOL Analytics Cannot Fix

Garbage in, gospel out: if a station is mis-calibrated, the analytics layer will faithfully track a drifting process and present it as "stable", so instrument calibration intervals and reference-standard traceability must be enforced upstream of any model [S2].
Plants that only log a statistical sample (the "every 1000 samples" pattern mentioned in one industry overview [S3]) lose the per-unit linkage that makes the analytics work in the first place.
Data quality at the OT/IT boundary: OPC UA, MQTT, and historians all introduce their own schemas and timestamps; without an agreed ontology for failure codes and station IDs, the analytics layer ends up reconciling data instead of analysing it [S2].
Organisational limits: a finding from Acerta's automotive work is that the bottleneck is rarely the algorithm, it is the closed loop from "model flags anomaly" to "process engineer changes a parameter", and that loop requires management action, not software [S1][S6].
When EOL Data Analytics Pays Off, and When It Does Not
The investment is justified when production volume is high enough that a 1 to 2 percentage-point FPY improvement returns more than the platform cost, when regulation demands per-unit traceability, and when failure modes are sufficiently varied that Pareto analysis alone runs out of road after the top three causes are fixed [S1][S2][S4].
It is a poor fit for low-volume, low-variability job shops where a single skilled inspector closes the loop faster than any model, and for early-stage production where the failure-mode distribution is not yet stable enough to train on [S1][S3].
A middle path used by growing contract manufacturers is to start with SPC and Pareto on the existing MES, then add streaming anomaly detection only on lines that have saturated the gains from those two layers [S2][S8].
Sourcing, Standards, and the Data Lakehouse Question
Per-unit test records end up in the same data lakehouse that holds MES, historian, and PLM data, and the storage layer is increasingly built on open table formats (Delta Lake, Iceberg) so that analytics, ML, and reporting tools share one copy of the truth [S2][S5].
The open-format, medallion-architecture pattern for OT/IT data integration discussed in the manufacturing data lakehouse reference applies directly to EOL test data, because the unit-level test record is one of the highest-value datasets a plant produces and it is also one of the most fragmented when formats are proprietary [S2][S5].
Functional safety standards (IEC 61508, ISO 26262, IEC 60601-1) and quality system standards (ISO 9001, IATF 16949, ISO 13485) all require records that the EOL analytics stack can produce natively, so a deployment that begins with the regulator's traceability requirements usually ends up with cleaner data than one that starts with a model [S2].
Trackable signals worth watching: ATE vendors (Advantest, Teradyne) shipping native real-time streaming rather than STDF batch as a default; MES vendors (Siemens Opcenter, PTC ThingWorx, Rockwell FactoryTalk) exposing EOL test data through open table formats; and the first plant-level case studies of predictive quality replacing a defined share of EOL test steps rather than merely adding analytics on top [S5][S8].