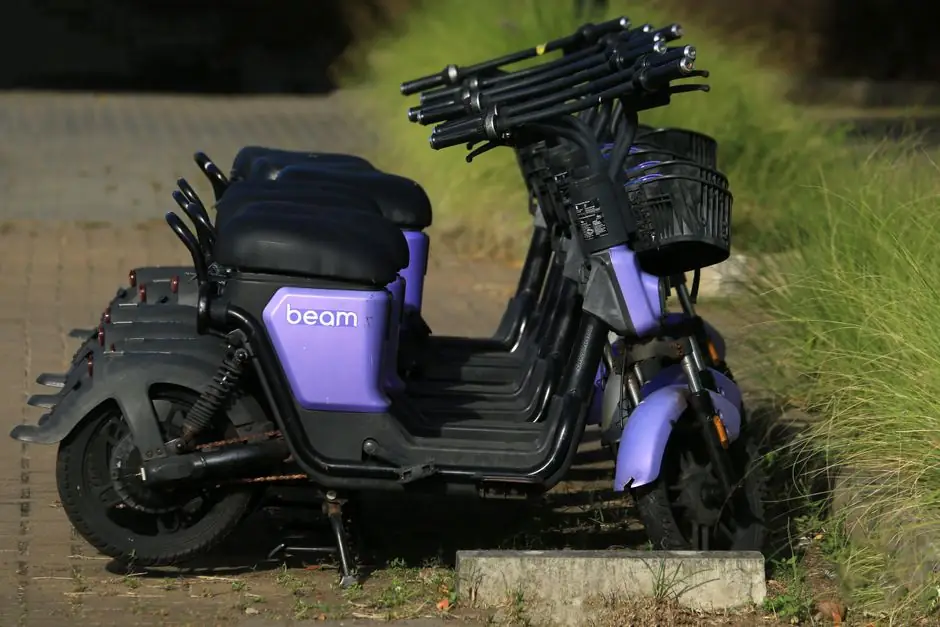
For 2026 spec cycles, NEV battery procurement is no longer a single line item: vehicle category dictates cell chemistry, BMS accuracy, and discharge C-rate, with LFP (lithium iron phosphate) recommended for passenger EVs, urban delivery, and e-bus packs, and NCM (nickel cobalt manganese) retained where high discharge rates dominate, per a 2025 application-specific design guide [S2].
Global EV and PHEV sales reached 14 million units in 2023 with a 17.4% CAGR projected through 2033, embedding battery cells inside a Stackelberg-style make-or-buy decision where in-house production competes with outsourcing under carbon-tax regimes [S1]. Procurement teams that frame RFQs around TCO, dual-sourcing, and compliance avoid the price-only trap that the same peer-reviewed work flags as the dominant cause of supply disruption [S1][S3].
Cell Chemistry and Vehicle-Duty Fit: The First Decision
LFP is the default for passenger EVs, urban delivery vans, e-buses, and 2-3 wheelers, with procurement focus on safety, cost-to-density ratio, warranty cycle, and BMS accuracy rather than headline Wh/kg [S2]. Heavy-duty and utility platforms (port tractors, mining trucks) typically pair LFP or high-rate NCM with advanced cooling and discharge C-rates above the 1C continuous / 3C peak envelope that defines a pure electric passenger pack [S2]. This chemistry-to-duty fit is the most cost-leveraged single decision an OEM buyer makes; every downstream spec, from pressure transmitter cooling-line instrumentation to BMS current sensing, hinges on it.
Beyond chemistry, a BEV pack must support deep discharge without lifespan penalty, integrate a thermal management system, and lay out cells against front/rear axle load distribution, while a PHEV pack must hold SOC between 50% and 85% and survive a 5-year cycle life target with hybrid-specific series or parallel connection logic [S2]. HEVs prioritise peak power and instantaneous discharge over energy; specifying the wrong cell for that profile cuts cycle life by an order of magnitude in field data cited by sourcing practitioners [S2][S3].
TCO Beats $/kWh: Modelling Procurement Around Operating Cost
A 2026 sourcing playbook defines battery sourcing as the full cycle of identifying, evaluating, negotiating, contracting, and managing battery cell, module, and pack suppliers, with TCO (Total Cost of Ownership) replacing unit price as the dominant comparison metric [S3]. For BEV passenger packs, the cost-to-density ratio and warranty cycle dominate TCO; for e-buses, safety certification and modular serviceability dictate lifetime cost; for heavy-duty, discharge C-rate, cooling design, and service-coverage geography set the real number [S2].
Midstream chokepoints amplify the TCO case: a documented 2026 electrolyte squeeze has already moved procurement teams from single-source to dual-source contracts, with midstream mapping becoming a board-level risk item rather than a category-manager task, as covered in the 2026 battery electrolyte shortage analysis. The same logic applies upstream: lithium carbonate price and chokepoint exposure now belongs in every RFQ appendix, not in a separate commodity hedge, per the lithium carbonate upstream-downstream map.
Make, Buy, or Hybrid: The Strategic Sourcing Question
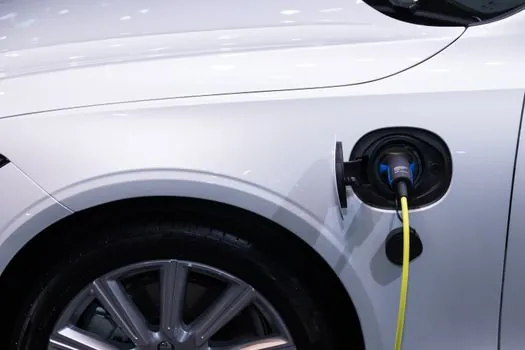
Peer-reviewed NEV supply-chain modelling frames the make-or-buy choice as a function of carbon-tax regime, R&D sunk cost, and Automotive Financial Services (AFS) penetration, with non-monotonic profit curves: manufacturer profits grow monotonically as AFS acceptance rises, while supplier profits dip and then recover beyond a critical consumer-acceptance threshold [S1]. AFS adoption effectively moderates carbon-tax burden, creating a sustainable competitive advantage for whichever tier owns the customer relationship.
Step-by-step sourcing methodology: define technical and volume requirements, map the supply market, qualify vendors, run a competitive tender, negotiate cells-plus-warehousing plus end-of-life takeback, and instrument the contract with SLA penalties tied to cycle-life and energy-throughput, not just on-time delivery [S3]. In-house R&D and production is favoured when supply stability outweighs capex drag, and outsourcing dominates when fiscal constraints under carbon policy are binding [S1].
Chemistry x Vehicle: A Decision Comparison
Five vehicle categories, ranked by the most binding selection criterion, give buyers a defensible comparison table drawn from the 2025 application-specific design corpus [S2]:
- Passenger EV: LFP, design priority = energy density and range, procurement focus = safety, cost-to-density, warranty cycle, continuous discharge ≤1C, peak ≤3C.
- Urban delivery: LFP, design priority = fast charging and high cycle life, procurement focus = charge efficiency, cycle count, BMS accuracy.
- E-Bus: LFP or pre-solid-state, design priority = safety and long life, procurement focus = safety certification, modular serviceability, maintenance cost.
- Heavy-duty / utility: LFP or high-rate NCM, design priority = high discharge and cooling, procurement focus = discharge C-rate, cooling architecture, service-coverage geography.
- Light EV (2-3W): LFP or LMO (lithium manganese oxide), design priority = low cost and reliability, procurement focus = unit cost, reliability, swappability.
Compliance, Standards, and Sourcing Risk
Six recurring challenges appear across 2026 battery sourcing audits: raw-material price volatility, geopolitical concentration of lithium and nickel refining, ESG and carbon-border reporting, IP and chemistry licensing, logistics and hazmat shipping, and end-of-life recycling takeback [S3]. The 2025 NEV supply-chain study adds a seventh: carbon-tax regime volatility, which is the variable that flips the make-or-buy optimum and which no off-the-shelf RFP template covers [S1].
Battery management tier mapping is the operational layer that turns these standards into verifiable test points; the battery management system suppliers map shows how IC, pack, and OEM tiers split responsibility for cell balancing, SOC accuracy, and thermal cut-off. Buyers who fail to align their sourcing RFQ with that tier map end up with redundant BMS layers or, worse, a gap between pack-level and cell-level safety certification that surfaces only in field failure.
Who This Strategy Is For, and Where It Breaks
The application-specific design model fits any OEM or tier-1 integrator whose portfolio spans more than one vehicle category: it is the only way to keep warranty reserves and field-failure data in a comparable format across passenger, bus, and heavy-duty lines [S2]. It is a poor fit for sub-10,000-unit annual programmes that cannot amortise the engineering cost of five distinct pack architectures, in which case a single LFP platform with derated performance is usually the lower-TCO answer.
The peer-reviewed make-or-buy model assumes carbon pricing is in force and that AFS or equivalent consumer financing is available to absorb part of the upstream cost shock; outside those conditions, the AFS-driven profit recovery at high consumer-acceptance thresholds does not materialise, and in-house R&D carries capex risk the model does not fully price [S1]. Specialty chemicals and electrolyte procurement, where midstream concentration is highest, require their own dual-sourcing clauses and pre-qualification of second-source cell suppliers before the RFQ is issued, not after a shortage hits.
Trackable signals for the next sourcing cycle: the 2026 electrolyte midstream squeeze resolution window, AFS penetration in major NEV markets, and any revision of carbon-tax thresholds in the EU and China that would shift the make-or-buy optimum a second time [S1][S2][S3].
Spec-level background on the components involved: linear guide, and crossed roller guide.