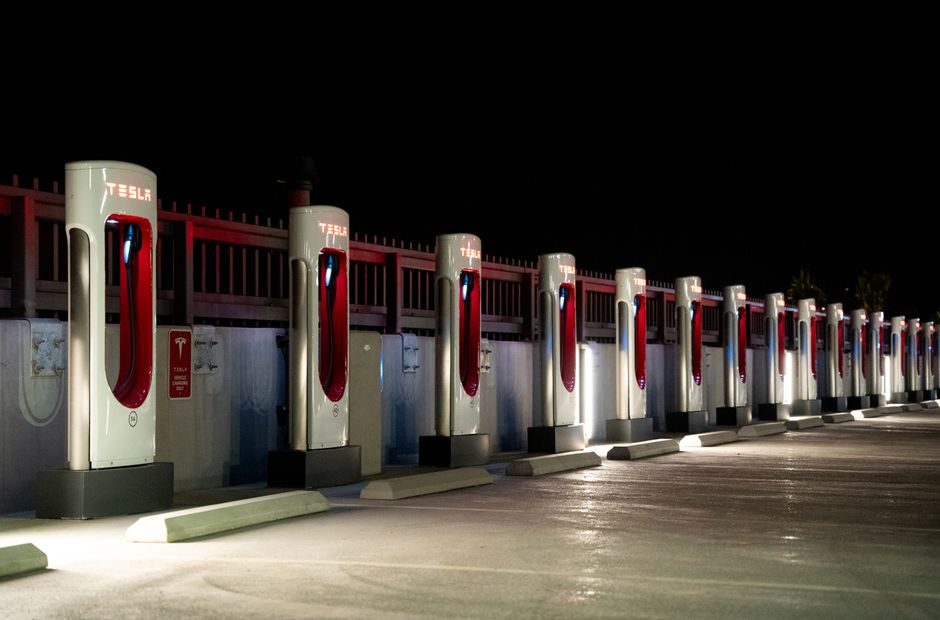
The global EV charging station market is projected to grow from USD 38.55 billion in 2026 to USD 120.85 billion by 2033 at a 17.7% CAGR, per a 380-page MarketsandMarkets report published in June 2026 [S2].
Base-year context from the same report places 2025 spend at USD 31.71 billion, and the 2022–2033 data series tracks a tripling-plus of revenue over the seven-year window, framed by analysts as a shift from infrastructure buildout to network scaling [S2]. For cross-reference, Allied Market Research models a parallel electric vehicle charging system market at USD 4,269.6 million in 2020, scaling to USD 42,623.0 million by 2030 at a 26.2% CAGR (2021–2030) [S3] — a narrower equipment-only scope but the same directional curve.
Segment Architecture: Fixed, Level 3, and DC Fast Lead the Curve
Fixed charging installations are estimated to dominate the 2026 mix, with Level 3 (DC fast) hardware registering the highest growth rate over the forecast window [S2]. MarketsandMarkets segments the build by DC Fast Charging, Charging Point (AC & DC), Level of Charging, and Installation type, plus Charge Point Operator and Connection Phase — a taxonomy that maps directly onto how OEM procurement and grid-side planners now spec sites [S2].
In application terms, public AC and DC deployments are scaling fastest, with highway fast-charging corridors and commercial fleet depots flagged as the highest-opportunity pockets [S2]. The growth-opportunity list in the report is explicit: "expanding charging infrastructure for commercial EV fleets, highway fast-charging corridors, wireless charging solutions, and AI-driven charging network management" [S2]. For buyers mapping pressure transmitter or flow meter requirements at a charging island — coolant skid, dielectric liquid conditioning, or load management — the Level 3 share gain is the spec that drives everything downstream.
Regional Split: Asia Pacific Largest, China Leading the Build
Asia Pacific is the largest growing region, with China identified as the country leader through 2033 [S2]. That picture aligns with the earlier Allied outlook that ranked Asia-Pacific first, followed by Europe, North America, and LAMEA on charging-system revenue [S3].
Lucintel's segmentation of the older 2015–2026 frame (BEV vs PHEV; Level 1/2/3; normal, super, inductive; portable vs fixed) called out APAC as the largest market on the back of government funding and infrastructure programmes, with North America and Europe as the next two regions [S1]. The MarketsandMarkets 2026 update carries that same hierarchy forward, while adding the operational layer: charge point operators, utilities, oil & gas majors, and automotive OEMs are now active deployers, not just regulators [S2].
Technology Lines: DC Fast, Ultra-Fast, MCS, V2G, Wireless
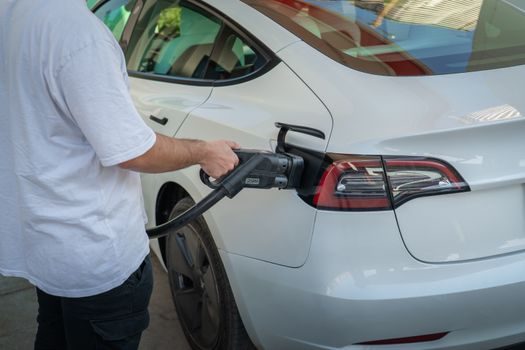
Four technology vectors are cited as the report's "growing trends": rapid deployment of DC fast chargers, ultra-fast charging stations, vehicle-to-grid (V2G) integration, and renewable energy-powered charging infrastructure [S2]. Competitive positioning is being reshaped by Megawatt Charging Systems (MCS) targeted at long-haul and commercial vehicle duty cycles [S2].
Adjacent data points from related reports give the sub-verticals a frame of reference. The wireless EV charging market is projected to grow from USD 466 million in 2023 to USD 12.4 billion by 2033, at a 38.6% CAGR (2024–2033) [S7]. MarketsandMarkets places wireless charging inside the same "growth opportunities" basket as fleet corridors and AI-managed networks [S2]. The wireless power transmission market is positioned by Future Market Insights as a "standards-led electrification layer" where interoperability and safety certification — not novelty — decide adoption speed [S10]. That framing matters for specifiers: SAE J2954 alignment, EMC behaviour, and grid-interactive behaviour are the gates, not headline power numbers. Related powertrain context in E-Axle Industry 2026: Oil-Cooled Motors, 800 V Integration and a 37.7% CAGR Reshape EV shows why 800 V architectures and oil-cooled motors are pulling the charger side toward higher sustained DC outputs.
Comparison of Main Charger Categories on Decision Criteria
A spec-driven buyer in 2026 is choosing between at least four hardware classes. Level 2 AC remains the residential and workplace default: low unit cost, simple installation, but limited to roughly 19 kW and dwell times measured in hours [S2]. DC fast (Level 3, 50–350 kW class) targets corridor and public-fleet sites where 20–30 minute turnarounds are commercially viable [S2]. Ultra-fast DC (350 kW and above) is the new build-out for highway corridors and is where MCS-over-1 MW enters the picture for heavy-duty trucks [S2]. Wireless charging is still an early-cycle line item, but the 38.6% CAGR projection from USD 466 M (2023) to USD 12.4 B (2033) is a credible upside bet for depots and captive fleets [S7].
On the four criteria most procurement teams track — power class, site/footprint, grid interconnection complexity, and per-port CapEx — fixed Level 3 DC fast currently dominates: highest power, smaller footprint than ultra-fast, mature grid-tie product, and falling per-kW cost. Ultra-fast wins on dwell time but loses on interconnection cost. Wireless is cheapest to operate on a captive-fleet basis but carries the highest interoperability risk per FMI's framing [S10]. For related load-side hardware, Programmable DC Power Supply Price 2026: Cost Bands and Drivers is a useful cross-reference for any lab or depot doing DC characterisation work.
Smart Charging, V2G, and Grid-Interactive Behaviour
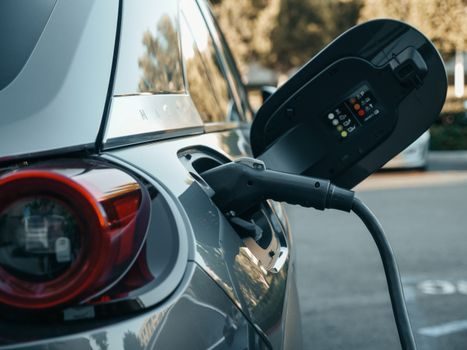
Smart charging technologies, IoT connectivity, and AI-enabled energy management are cited as the "Smart Charging Impact" — improving charger efficiency, optimising power distribution, and supporting grid stability [S2]. That is the operational language buyers should track: not kW alone, but how the site behaves as a dispatchable load or, with V2G, a distributed asset [S2].
MarketsandMarkets explicitly lists V2G integration and renewable energy-powered charging as trend lines, with the report's "growing trends" block: "rapid deployment of DC fast chargers, ultra-fast charging stations, vehicle-to-grid (V2G) integration, and renewable energy-powered charging infrastructure" [S2]. For process and electrical engineers sizing site infrastructure, this is the difference between a passive load and a grid-interactive node — and it changes the spec for upstream industrial valve skids, transformer tap changers, and DC link protection. Captive fleet depots with predictable dwell windows are the proving ground, mirroring the depot logic that anchors the wireless EV case [S7].
Who This Market Is For, and Where It Is Not
The forecast is for charge point operators, utilities, oil & gas majors, automotive OEMs, and the supplier base around them — switchgear, cooling, cable, payment, and energy management [S2]. It is not a retail-margin story for the residential Level 1/Level 2 side alone, where unit ASPs and per-port revenue are thin compared with commercial-fleet and corridor DC fast [S2].
For a 2026 spec engineer, the relevant question is which segment they are sitting in. If you are specifying a depot for last-mile delivery or a 350 kW corridor site, the MarketsandMarkets data places you inside the highest-CAGR and highest-revenue band [S2]. If you are sizing a small office Level 2 build, the same report still counts the spend, but the volume and margin centre of gravity is elsewhere. The cross-vertical powertrain demand in E-Axle Suppliers 2026: Spec-Driven Shortlist for EV Powertrain Engineers reinforces the same conclusion: the high-voltage, oil-cooled, 800 V axis is where volume is migrating, and the charging side is being pulled with it.
Limitations, Failure Modes, and Sourcing Notes
Forecast ranges diverge materially. MarketsandMarkets puts 2033 revenue at USD 120.85 billion at 17.7% CAGR [S2]; Allied's narrower charging-system scope lands at USD 42,623.0 million by 2030 (26.2% CAGR 2021–2030) [S3]; Lucintel's earlier 2021–2026 frame cited 31%–33% growth and pointed to portable as the largest and fastest-growing segment, which sits oddly against the fixed-dominated 2026 read from MarketsandMarkets [S1]. The split is methodology: scope, segment definition, and base year all differ across the three.
Other constraints to track: (1) wireless EV is real but small in absolute terms at USD 466 million in 2023, even at a 38.6% CAGR [S7]; (2) standards-led interoperability is the gating factor per FMI on wireless power transmission, not technology novelty [S10]; (3) earlier Lucintel data on inductive charging being a discrete segment suggests a residual market for non-contact options, but quantitative share is not in the 2026 refresh [S1]. Sourcing this article: primary numbers are from MarketsandMarkets 2026-06-25 [S2], Allied 2022-07-13 [S3], Lucintel 2026-05-15 [S1], and adjacent wireless and wireless-power figures from Allied 2026-06-08 [S7] and FMI 2026-02-17 [S10]. Cross-checks: MarketsandMarkets' earlier 2025-06-18 release positioned the same EV charging station industry at USD 76.31 billion by 2032, so the 2026 refresh has revised both horizon and base year [S4].
Next signal to watch: the second-half 2026 release of corridor and MCS utilisation data from the major charge point operators, and any 2026 update to the MarketsandMarkets base year of 2025 [S2]. A second trackable node is the wireless EV charging line — if 2024–2025 actuals print anywhere near the 38.6% CAGR curve, the sub-vertical stops being a footnote and starts to shape fleet-depot specs [S7].