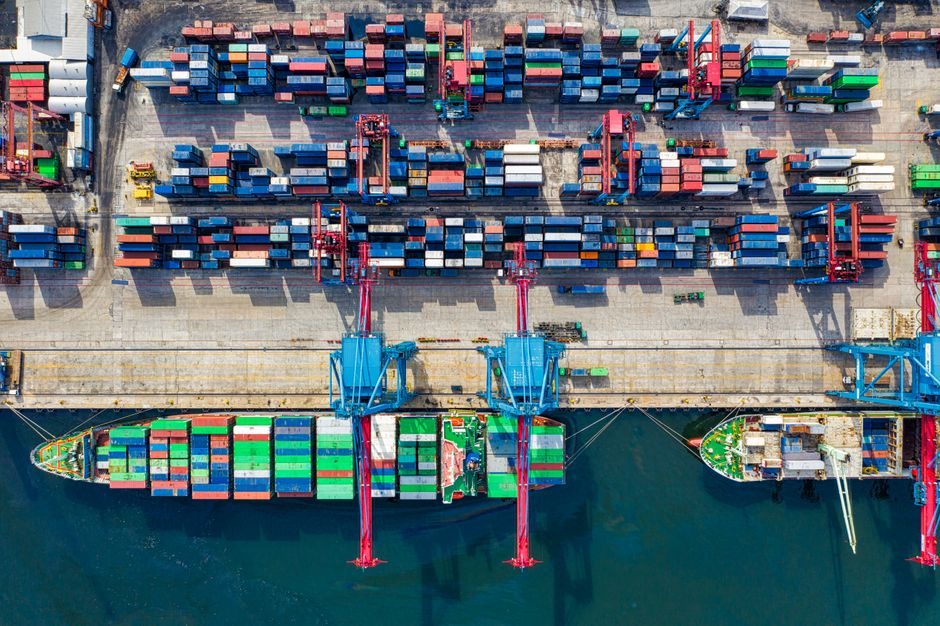
Cross-border trade in electric vehicles is now run from customs data, not show floors: 200+ country shipment records feed verified buyer-seller matching, while Chinese wholesale listings in July 2026 sit at US$19,000-21,200 per BEV unit for SUV-class vehicles [S1][S6].
The B2B trade data backbone covers 200+ countries, with shipment records, HS-code level transaction counts, transaction weight, and unit price trends all surfaced by month and by supplier [S1]. The same platforms expose NEV-flow buyers and trading companies, including the Shandong-based Sihai Heyue import-export trading entity listing Voyah Zhiyin-class SUV units at US$21,000 MOQ 1 [S4].
China-Origin BEV Wholesale Price Band, July 2026
Made-in-China.com listings for July 2026 show new-energy SUV BEVs clustered at US$19,000-21,200 per piece, with BYD Song PLUS EV and Toyota bZ4X-class units anchoring the lower and upper ends respectively, both at MOQ 1 [S6]. A separate Shandong trading entity lists the Voyah Zhiyin electric SUV at US$21,000/unit, 1-piece MOQ, under the new-energy import-export catalog code CD_New-Energy-Vehicles [S4].
Component-level flows are 30-50x cheaper per piece: 10-inch hub-motor side covers and drum-brake covers from Wuxi suppliers post at US$6.00 per piece at 100-piece MOQ, with certified OEM aluminum motor housings listed in the same motor-cover category [S3]. For a process engineer specifying a sourcing plan, the per-unit spread between finished NEV (US$19,000-21,200) and motor-cover component (US$6.00) is roughly four orders of magnitude, which is the gap between vehicle-level and Tier-2 motor-parts sourcing.
EV Plastics Adjacency: Material Volume Behind the Trade Flow
The upstream plastics market behind those vehicle flows is forecast to grow from US$3.9 billion in 2025 to US$45.8 billion by 2035, a 28.0% CAGR over the 2025-2035 horizon, with BEVs holding 38.2% of the demand and polypropylene leading the resin mix at 25.7% share [S2].
For an import-export analyst, the practical read-through is that PP, PA, and PC resin HS-codes (Chapter 39) will rise in tandem with Chapter 87 (motor vehicles) on the same customs declarations, especially on shipments out of Chinese petrochemical hubs to European and Southeast Asian assembly plants. The plastics forecast base year is 2024, with historical data 2015-2024, which means Q3 2026 customs baselines already sit on top of a year that was 1.5x the 2015 polymer baseline [S2].
Customs Data Layer: HS-Code Granularity and Supplier Trend Charts
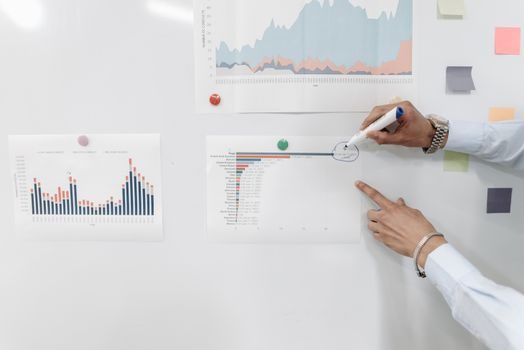
Trade-intelligence platforms expose three layers of decision data: HS-code level shipment records, product description strings, and per-supplier transaction trend charts that disaggregate by month and by year for transaction count, quantity, and weight [S1][S5]. A live 2025-2026 trend chart for Changxin Import Export Trading Limited, for example, surfaces procurement cycle, business scale, and stability through that 12-24 month window [S5].
Buyers, ports, and partners are queryable alongside HS codes, which is what lets a sourcing manager validate a Voyah Zhiyin or BYD Song PLUS quotation against actual declaration weight, declared unit price, and end-port of discharge before issuing a purchase order [S1][S5]. The same workflow pulls Ait Worldwide Tampa-level buyer data, with 2023-2024 trade trend curves providing the YoY baseline for 2026 forecast error [S7].
Selection Logic: Which Data Source to Use for Which Decision
Three source classes cover the EV import-export workflow, and they answer different questions: (1) global shipment-record databases with 200+ country coverage are the right tool for buyer discovery and market sizing [S1]; (2) B2B wholesale platforms like Made-in-China.com are the right tool for spot FOB price discovery and MOQ validation on specific vehicle or component SKUs [S3][S4][S6]; (3) per-supplier trend charts on trade-data portals answer the question of supplier stability and procurement-cycle timing [S5][S7].
A practical sourcing stack layers all three: a 200+ country database for market-size and buyer-list pull, a wholesale catalog for live FOB price and MOQ sanity-check, and a per-company trade-trend chart for counter-party due diligence [S1][S5][S6]. For buyers evaluating Chinese OEM trade entities, the per-supplier 12-24 month transaction count is the single best predictor of on-time shipment performance, since declared shipment count is the only signal not self-reported by the seller [S5].
Who This Data Is For, and Where It Fails
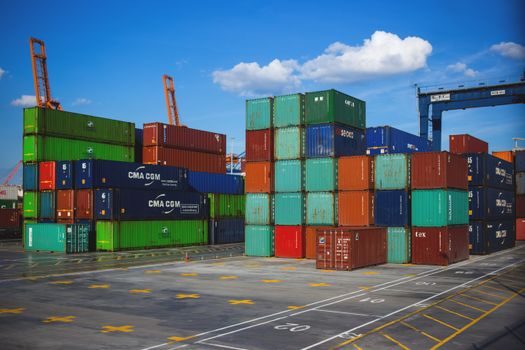
EV import-export data is for trade-finance, sourcing, and market-entry teams that need HS-code level transaction visibility before committing to a 50-200 unit container PO; it is not a substitute for homologation data, type-approval certificates, or port-side pre-shipment inspection [S1]. Customs shipment records also do not reveal dealer-level margin, in-country homologation cost, or warranty exposure, all of which sit outside the HS-code declaration.
The data also fails when buyers need to distinguish homologated from non-homologated units, since HS-code 8703.80 declarations do not encode UN R100 / GB/T electrical safety compliance at the line-item level [S1][S4]. A sourcing manager comparing a US$19,000 BYD Song PLUS listing to a US$21,200 bZ4X-class unit must still validate WLTP range, battery certificate, and destination-country type approval separately from the customs record [S4][S6].
2026 Sourcing Signals to Track
Two signals are worth watching through Q4 2026: (1) the per-piece FOB spread on Chinese OEM BEVs (currently US$19,000-21,200 for SUV-class) tightening or widening will signal whether EU CBAM-adjacent tariffs and US Section 301 adjustments are landing in declared unit values [S6]; (2) HS-code 8703.80 transaction count growth against the 28.0% CAGR plastics forecast base will signal whether component flows are scaling with vehicle flows or decoupling [S2].
Cross-checking these against the China lithium battery export flow trajectory and the China-anchored solar capacity mix gives a triangulated view of China's NEV supply-chain outbound volume, since battery HS-code 8507.60 and Chapter 39 polymer codes usually co-move with Chapter 87 vehicle declarations on the same shipper records.
For component-level specifications, see data logger, electric actuator, and electric ball valve.