
On a typical hydrocarbon-service piping run, the bolted flange joint is the lowest-cost line item on the BOM and the highest-cost line item on the maintenance log, which is exactly the inversion a total-cost-of-ownership model is built to expose [S3].
Spec engineers who price flanges on per-piece quote lose sight of installation labor, torquing rework, hot bolting, and the lost-production hours tied to a single leak; on a 20-30 year service window, those line items routinely dwarf the invoice from the foundry.
What Flange TCO actually includes
The standard TCO formula sums acquisition, operating, maintenance, downtime, and end-of-life costs, then subtracts residual or scrap value, with all future cash flows discounted to present value through an NPV step for multi-decade assets [S3][S5].
For a flange, acquisition breaks into the unit price, mill test certificates, NACE MR0175 compliance surcharge where sour service applies, gaskets, studs, nuts, and the field labor to align, torque, and hydrotest the joint. Operating costs on a static joint are minimal unless the line is traced or insulated, in which case energy loss and re-insulation after inspection are recurring.
Maintenance is where flanges punish under-specified BOMs: re-torque during the first hot cycle, re-gasketing after every turn-around, and replacement when faces become pitted or distorted. Downtime, often omitted from a purchase comparison, is the line item that swings the spreadsheet; on a refinery or ethylene unit, a single flange leak can price six figures per hour in lost product and deferred throughput, which is why TCO discipline explicitly lists lost production and opportunity cost as first-class entries [S3].
Where the 10-15% purchase-price share comes from
Reliability-industry TCO literature converges on a consistent ratio: the initial purchase price of an industrial asset is often only 10-15% of its total lifecycle cost, with operations, maintenance, and downtime making up the rest [S3][S4]. The ITT white paper makes the same point for rotating equipment and notes that organizations which measure and analyze those hidden costs tend to outperform peers on both uptime and margin.
For flanges, the math is even more skewed than for pumps. A 2-inch Class 150 weld neck in A105 carbon steel may invoice at tens of dollars, but a plant with 5,000 such joints amortizes torque verification, RTJ or spiral-wound gasket replacement, bolt renewal, and the occasional hot re-make across every turnaround cycle. When the per-joint annual maintenance burden is multiplied by the joint count and the typical 25-year asset life, the purchase share collapses well below 10% of total cost, and the design choice on face type, material, and bolting dominates everything else.
Cost drivers that move the flange TCO line
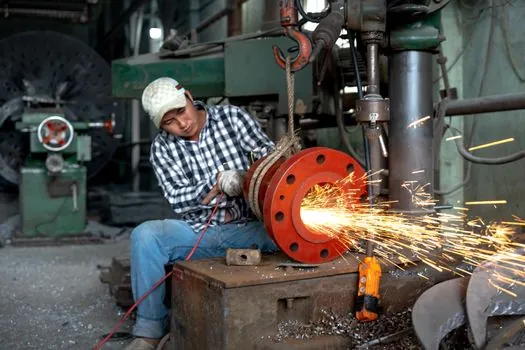
Material grade is the largest cost driver after labor, with stainless 304/316 flanges running roughly 2-4x the price of A105 carbon steel, and alloy grades such as F51, F55, or Inconel 625 climbing another step when the line sees chloride, sour, or high-temperature service. Pressure class adds a second multiplier: a Class 600 flange in the same size and material costs meaningfully more than a Class 150 because of the heavier wall, larger bolt circle, and thicker raised face or ring-joint groove. [S2]
Face type is the third driver and the one most often misjudged. A flat-face slip-on is the cheapest flange you can buy and the most expensive flange you can own on a cyclic or thermal-service line, because the gasket seating geometry is the weakest in the ASME B16.5 family. Weld neck with raised face (RF) or ring-joint (RTJ) costs more at issue but eliminates the bending stress at the joint, which is the dominant leak driver in hot hydrocarbon service. Bolt and gasket selection completes the picture: spec'ing B7 studs instead of B16, and a flexible graphite or spiral-wound gasket matched to the service, adds a small material premium and a large reduction in hot-cycle re-torque events.
Volume and lead time are the procurement-side drivers. A 50-piece emergency order of exotic flanges in the middle of a turnaround costs more per joint than a 1,000-piece blanket order placed during a planned outage window, because foundry surcharges, freight expediting, and the opportunity cost of crew idle hours all stack. Contract-manufacturing and supplier-managed inventory models are explicitly framed in TCO literature as a way to lower the acquisition-plus-inventory line of the formula, with lead-time compression being one of the most cited savings levers [S6].
Comparison: weld neck vs slip-on vs lap joint on TCO criteria
On a hot, cyclic hydrocarbon line at 1.5-3.0 kW of trace heat and 40-bar working pressure, the three common flange choices line up against four TCO-relevant criteria as follows. Purchase cost ranks slip-on cheapest, lap joint mid, weld neck most expensive on the per-piece quote. Installation labor favors slip-on because alignment is forgiving, but weld neck and lap joint pay that back through fewer alignment shims and shorter fit-up hours on large-bore joints. Leak risk over the first three turnarounds is highest on slip-on flat face, mid on lap joint, lowest on weld neck with RTJ, because the butt-welded hub removes the bending moment at the gasket. Maintenance frequency on a 25-year horizon is driven by face integrity: slip-on and flat-face joints typically need re-machining or re-gasketing one cycle sooner than a properly torqued weld neck, which compounds downtime exposure across the asset life. Specifying flanges by face and material, not by per-piece price, is the single decision that moves the most lifecycle dollars. [S2]
Failure modes that quietly inflate flange TCO
Four failure patterns dominate unplanned flange spend in process plants. First, flange rotation on a slip-on joint after torque relaxation, which requires re-alignment and re-gasketing. Second, bolt thread galling on B7 studs when re-used beyond one torque cycle, which forces full stud-and-nut replacement and inflates maintenance cost. Third, galvanic corrosion at the gasket interface when dissimilar metals are paired without an isolating gasket, which shortens gasket life and pits the flange face. [S2]
Fourth, the parent-pipe stress problem: a thin pipe scheduled against a heavy flange class creates a stress concentration at the weld, and the joint leaks not because of the gasket but because the line flexes beyond the gasket can follow. This is the failure mode that proactive precision-maintenance programs, with proper alignment, torquing, and bolt-pattern verification, are reported to reduce by 10-40% versus purely reactive approaches, with additional 8-12% savings over time-based preventive schedules [S3]. The pattern is mechanical-equipment data, but it transfers cleanly to static joints because the failure-cost profile is the same: emergency repair, lost production, premature replacement.
Total-cost-of-ownership rules of thumb for spec work
Three rules consistently appear in TCO literature and apply cleanly to flange selection [S3][S4]. First, the initial purchase price is a small share of total cost, so any savings below 10% on the invoice rarely justifies a downgrade in material or face type once maintenance and downtime are priced in. Second, TCO discipline is a cross-functional exercise: purchasing, operations, and maintenance must agree on the model or the spreadsheet will quietly revert to lowest-bid logic.
Third, TCO is a comparison tool, not a single-number output; the goal is to compare two or three flange configurations on the same joint and same service over the same horizon, not to declare one absolute number for all flanges in the plant. Adopting that posture also justifies a structured bill of materials review, because the BOM row is the unit at which TCO can actually be modeled and audited. For a real-world procurement pattern where contract-manufacturing and volume-tiering show up in the same week as new project awards, a similar TCO lens applies to cement-plant piping and to stainless-steel commodity spares, where cheap on paper turns into expensive on the turnaround schedule.
Implementation: how to run a flange TCO on a single joint
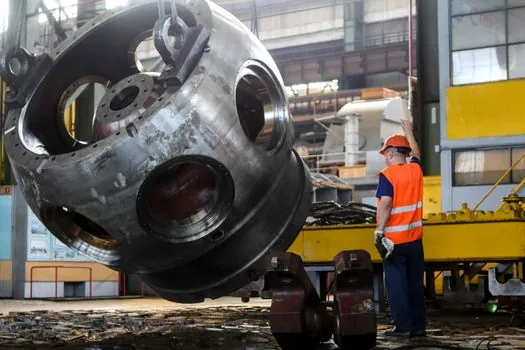
Start with the joint definition: line size, ASME B16.5 or B16.47 class, material, face type, service fluid, design temperature, design pressure, and expected cycle count. Pull the unit price, gasket cost, stud-and-nut cost, and estimated install hours for each candidate flange configuration. Add a planned-maintenance line: one re-gasket event at mid-life, one stud renewal at end-of-life, and a probability-weighted unplanned leak event drawn from plant history. [S2]
Convert downtime hours into dollars using the unit's lost-margin rate, which is the line that TCO literature flags as most often omitted and most often decisive [S3]. Discount all future costs to present value, subtract any scrap or resale credit at decommissioning, and the TCO per joint will sit somewhere in the low-hundreds to low-thousands of dollars depending on size, alloy content, and service severity. Run the same model for two or three candidate configurations and the price-driven choice will often flip to a higher-material weld neck or RTJ joint once unplanned downtime is priced honestly. The numbers will not be the same for every joint, which is exactly why a per-joint TCO is the right resolution; an averaged plant-wide number hides the high-leverage joints that drive 80% of the maintenance spend.
The next trackable signal is a published cost-of-downtime benchmark by refinery, ethylene, or LNG unit, which would let spec teams convert flange leak probability into a defensible dollar figure rather than an internal estimate; watch for API and AFPM joint working-group output over the next two reporting cycles. The second is an updated ASME B16.5 or B16.47 annex on bolting torque verification cycles, which directly drives the maintenance line of every flange TCO model.
The underlying component specifications are covered under total station, and pressure transmitter.