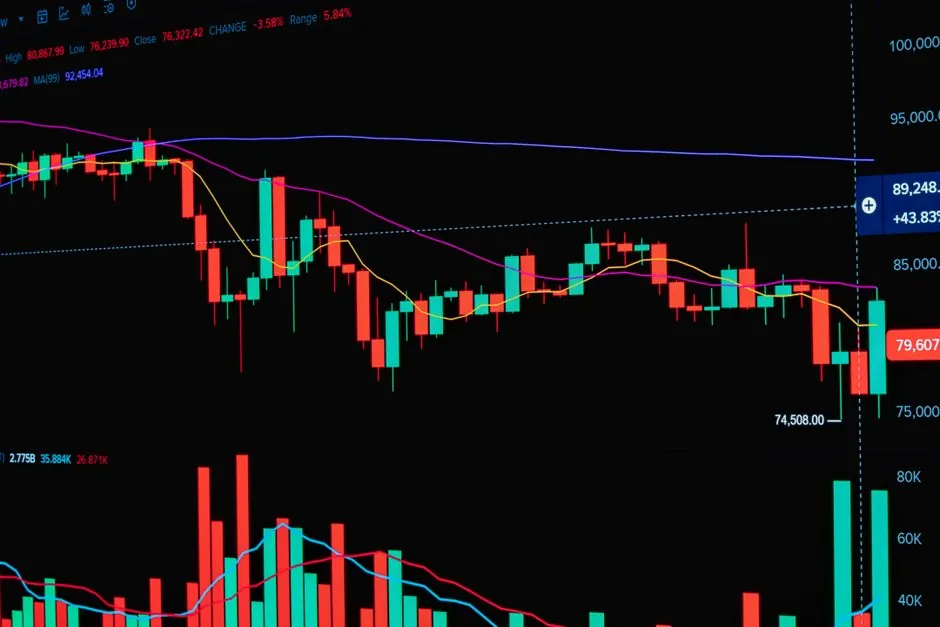
Float glass prices in 2026 are diverging sharply by region: Chinese EXW averaged USD 1,190/MT in July 2026 versus USD 830/MT in Germany and USD 1,030/MT in the USA, on the same incoterm basis [S3]. The September 2026 reading showed China at USD 1,306/MT, Germany at USD 683/MT, France at USD 709/MT, the UK at USD 861/MT, and the USA at USD 1,117/MT [S5].
Behind the spread, the market is also rebalancing by product mix. Clear glass still led with 62.70% of 2025 volume [S1], but solar-grade low-iron float is the fastest-growing application at an 8.01% CAGR through 2031, against a 3.48% CAGR for the whole float glass category [S1]. For procurement, the practical question is no longer "what is the price of float glass" but "what am I buying, on what basis, and for which end-use."
Q3 2026 Regional Price Levels, EXW and CIF
Procurement Resource reported the August 2026 band as China USD 1,180/MT EXW, USA USD 1,000/MT EXW, Germany USD 800/MT EXW, Australia USD 1,280/MT CIF, and Brazil USD 1,360/MT CIF [S3]. The Australia and Brazil CIF numbers run 8-15% above the China EXW number, which is the rough landed-cost premium buyers should expect when sourcing from Asia into the southern hemisphere [S3].
IMARC's Q3 2026 series moves in the same direction but with a wider Europe-US gap: Germany USD 683/MT, France USD 709/MT, UK USD 861/MT, USA USD 1,117/MT, China USD 1,306/MT, all September readings [S5]. Germany is the cheapest quoted market in the Q3 2026 data at USD 683/MT, with France at USD 709/MT, the UK at USD 861/MT, and the USA at USD 1,117/MT [S5]. For an apples-to-apples comparison, always confirm incoterm (EXW vs CIF vs DDP) and currency, since basis moves can swing a quote by USD 100-200/MT before any real price change.
Earlier in the year the Chinese benchmark 5/6 mm transparent float fell about 6.4% between early April and mid-June 2026, while German and US producer prices stayed roughly 5% and 6% higher year on year in May 2026, respectively [S3]. That split is the clearest signal in the dataset: Asia is demand-soft, the West is cost-supported.
What Is Actually Moving the Price: Energy, Soda Ash, and Carbon
Soda ash, silica sand, natural gas, electricity, and cullet are the five cost line items that move float glass price the most. IMARC explicitly cites elevated natural gas and electricity costs at float line operations in Germany, France, and the UK during Q3 2026, plus firm feedstock costs for soda ash and silica sand in the USA [S5]. A float line is one of the most energy-intensive unit operations in materials manufacturing, so any sustained change in industrial gas or power tariffs flows almost directly into the EXW price.
Carbon cost is the second lever, harder to see but increasingly material. Glass Magazine's World of Glass 2026 report describes the 2025-2026 period as shaped by tariffs, inflation, and rising costs, with companies "working to secure, and even expand, float glass supply" while pushing energy-efficient and sustainable solutions such as vacuum insulating glazing and thin glass [S2]. European producers face a stacked energy + carbon + labor cost burden; Chinese producers do not, and that gap is what keeps the China-vs-Europe price spread at roughly USD 400-500/MT [S3][S5].
For buyers, this means two practical levers: lock multi-quarter contracts when forward energy curves are stable, and accept a regional price floor in Europe and North America that Chinese offers cannot beat on a like-for-like basis once freight, insurance, and any anti-dumping duty are added.
Solar Glass: The Fastest-Growing Slice of the Float Mix

Solar glass is the only float-glass segment expanding meaningfully faster than the parent market. Mordor Intelligence puts the float glass market at 76.86 million tons in 2026, growing to 91.18 million tons by 2031 at 3.48% CAGR, with solar glass advancing at 8.01% CAGR through 2031 [S1]. By application, building and construction still dominates with 74.60% of 2025 volume, but solar is the marginal demand driver [S1].
The same driver-impact table flags utility-scale solar buildouts as adding +0.9% to the headline CAGR on a short-term (less than 2 years) timeline, and BIPV façade regulations adding another +0.3% on a long-term (4+ years) timeline [S1]. For procurement this matters because solar-grade low-iron float requires higher purity silica, tighter thickness control (commonly 2.0-3.2 mm for module cover glass), and more demanding optical specs, which translates into a price premium over commodity clear float even before tariffs.
Glass Magazine notes that the tariff environment in 2025-2026 is "pushing more onshoring of solar panel production and automotive glass," which is "consuming a large portion of" available capacity [S2]. That capacity reallocation is one of the reasons Chinese EXW prices have softened for construction-grade clear float while solar-grade offers have stayed firmer; producers are chasing margin into the solar channel. Related pricing dynamics in fiber-reinforced glass inputs are covered in Glass Fiber Pricing in 2026: Roving and Chopped Strand Cost Drivers, which traces the same soda-ash and energy logic one tier up the supply chain.
Application and End-Use Mix: Where the Volume Is Going
By product type, clear glass held 62.70% of 2025 float glass market share and is growing at 3.79% CAGR through 2031 [S1]. By application, building and construction led with 74.60% in 2025, while solar glass is the fastest-growing application at 8.01% CAGR [S1]. By geography, Asia-Pacific accounted for 62.65% of 2025 volume and is projected to expand at 3.92% CAGR to 2031 [S1].
For a buyer, the split matters more than the headline number. The same tonne of float glass sold into a Shanghai residential tower is priced very differently from the same tonne sold into a US utility-scale PV plant or a German automotive glazing line. Glass Magazine's report describes how the "new reality" of tariffs has pushed fabricators that historically imported glass to switch to domestic sourcing or to countries with lower glass tariffs, with Vitro leveraging its North American asset network to shift production across sites [S2]. That kind of capacity choreography is now a permanent feature of the market.
Demand signals outside the float market also feed back into price. Tight alloy steel lead times, for example, affect the cost of frames, mounting hardware, and jigs for glass handling, a downstream link explored in Nickel and Chromium Surcharges Stretch Alloy Steel Lead Times Past 7 Months. Buyers running integrated scope should treat glass and steel lead times as a coupled planning problem, not separate procurement workstreams.
Comparing the Main Options: Clear vs Low-Iron, Architectural vs Solar

The decision matrix for a procurement engineer in 2026 is essentially four-way, and each option trades cost against optical and mechanical performance. Commodity clear float (typically 4-6 mm, iron content around 800-1,000 ppm Fe2O3) is the cheapest and is correct for windows, storefronts, and most interior partitions. Low-iron float (commonly less than 150 ppm Fe2O3) costs a premium and is mandatory for solar cover glass and premium façades where edge color must be neutral. Patterned solar glass and anti-reflective coated glass sit above that, with vacuum insulating glazing and thin glass (sub-2 mm) at the top of the cost stack [S2].
On decision criteria: cost favors clear float in China EXW; optical clarity favors low-iron; energy performance favors vacuum insulating glazing; solar yield per watt favors anti-reflective coated low-iron. The Mordor driver table reinforces that BIPV façade regulations are a long-term (4+ years) demand pull for ultra-clear low-iron substrates, mostly in Europe with early adoption in North America and APAC urban centers [S1]. If your project is a 5-year-plus façade in a regulated EU market, spec low-iron now; if it is a 12-month retail fit-out in a soft Asian property market, commodity clear will land cheapest.
Buyers should also be aware of basis creep. EXW China at USD 1,180-1,306/MT in 2026 is not directly substitutable for CIF Brazil at USD 1,360/MT or CIF Australia at USD 1,280/MT, and a DDP quote into a US project will sit above the USD 1,000-1,117/MT EXW USA range once inland freight and any Section 301 or anti-dumping duty is layered on [S3][S5]. Always pin the incoterm in the PO.
Tariffs, Trade Flows, and Capacity Additions in 2026
Trade policy is the single biggest non-commodity variable in 2026. Glass Magazine documents that fluctuating tariffs in 2025-2026 pushed historically importing fabricators to switch to domestic sourcing or to countries with lower glass tariffs, and that onshoring of solar panel and automotive glass production is absorbing a large share of available float capacity [S2]. The same report notes that the National Glass Association's World of Glass Map, updated as of August 2025, is the canonical reference for global float line locations, top-grossing North American fabricators, and US recycling facilities [S2].
Capacity additions are running in parallel. Mordor describes "multibillion-dollar capacity additions scheduled in both China and the United States" rebalancing the float glass market toward regionalized supply chains that prioritize resilience and carbon efficiency [S1]. That regionalization is the structural reason the China-vs-US price gap has stayed at roughly USD 200-300/MT EXW through 2026, even as the China EXW absolute number has fallen [S3][S5]. The arbitrage window for Chinese exports into the US is narrower than it was in 2023-2024.
For European buyers, the message is similar: the Q3 2026 IMARC spread of USD 683/MT in Germany to USD 861/MT in the UK is largely a function of energy mix, carbon cost, and currency, not freight [S5]. Sourcing German product into the UK does not erase the cost gap; only a structural change in UK industrial energy policy would.
Selection Criteria and What to Track Next
If you are specifying float glass in late 2026, the criteria that should govern the buy are, in order: (1) end-use optical and mechanical spec, since solar and BIPV demand low-iron and tighter thickness control; (2) regional basis, because the same tonne is USD 200-600/MT cheaper in Germany than in the USA or China depending on direction [S3][S5]; (3) tariff and anti-dumping exposure, which the NGA World of Glass Map and Glass Magazine coverage tracks at country-pair level [S2]; (4) energy and carbon cost pass-through, which sets the European floor; (5) volume tier and contract length, which determine whether you see spot or contract pricing.
For a property developer, the right choice is usually commodity clear float on an EXW or DDP basis, with the cheaper of Germany, China, or the USA picked on tariff-adjusted landed cost. For a solar EPC or module manufacturer, low-iron float on a multi-quarter contract is the only sensible answer, and the marginal premium over clear float is the price of staying on schedule as Asian solar-grade capacity tightens. For a façade engineer chasing long-term energy performance, vacuum insulating glazing or thin-glass solutions [S2] carry the highest upfront cost but the lowest operational drag.
Trackable signals into Q4 2026 and Q1 2027: (a) whether the China 5/6 mm transparent benchmark stabilizes after the April-June 2026 decline of about 6.4% [S3] or breaks lower on continued property weakness; (b) whether European producer prices hold their roughly 5% year-on-year premium into the winter heating season [S3]; (c) whether the announced Chinese and US capacity additions land on schedule, which would re-widen the arbitrage window. For context on how soda-ash and energy cost pass-through ripples through related industrial materials, the alloy steel surcharges piece traces the same upstream energy and feedstock logic in a different vertical.
Spec-level background on the components involved: checking and testing apparatus, construction machinery and equipment, and lamps and light fittings.