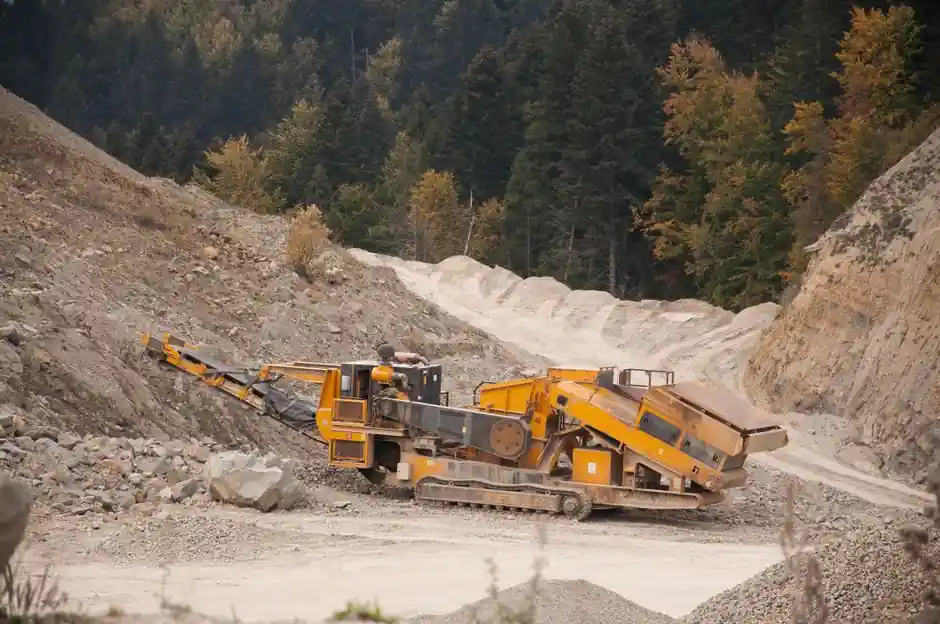
The dedicated ground improvement equipment market reached US$241 million in 2025 and is projected to reach US$301 million by 2032 [S6], a small line item compared with the US$7.87-9.8 billion 2025 base of the surrounding ground improvement service and technology segments [S1][S3].
Adjacent markets are pulling that equipment demand forward: the ground improvement service market is forecast to grow from US$9.8 billion in 2025 to US$17.6 billion by 2034 at a 6.8% CAGR [S1], while soil stabilization material demand sits at US$26.2 billion in 2025 with a 5.65% CAGR projection [S7], and soil testing equipment is on track to reach US$6.5 billion in 2026 and US$12.9 billion by 2033 at a 10.3% CAGR [S2].
Equipment market sizing versus service market sizing
The equipment-only slice of ground improvement is small in dollar terms: US$241 million in 2025, scaling to US$301 million by 2032, an implied CAGR of roughly 3.2% [S6]. That is materially below the 6.3% CAGR projected for ground improvement technology at US$7.87 billion in 2025 reaching US$10.12 billion by 2033 [S3] and the 6.8% CAGR on US$9.8 billion through 2034 in the service report [S1]. A wider ground improvement technology dataset from DataHorizzon Research puts the technology spend at US$28.4 billion in 2025 expanding to US$47.9 billion by 2033, a noticeably higher reading than the Verified Market Reports number and worth noting when reconciling the two figures [S8].
For a process engineer specifying kit, this gap is the key takeaway: equipment is only the visible capex line, while service contracts, binders, monitoring, and project execution form the larger and faster-growing spend layer. Mechanical compaction alone held a 34.2% technique share of the 2025 service market [S1], implying the vibratory hammers, rollers, and downhole tools feeding that 34% slice account for a large share of the US$241 million equipment base [S6].
Technique and application split inside ground improvement
Mechanical compaction is the dominant technique at 34.2% of 2025 service revenue, with infrastructure applications leading end-use at 38.5% [S1]. On the technology taxonomy used by Verified Market Reports, Type I technologies cover drainage-assisted consolidation of fine-grained soils and Type II cover compaction methods, with jet grouting, vibro-compaction, and chemical stabilization cited as the historical technique drivers [S3].
Application-side, the infrastructure segment ties directly to highway, rail, and port megaprojects that have been the consistent volume driver since 2020 [S1][S3]. Agricultural and architectural (typo preserved: "Achitechive") applications are listed as primary end uses in the same dataset but at much smaller share, while the US$26.2 billion 2025 soil stabilization material market is where binder consumption (cement, lime, fly ash, bio-additives) shows up [S3][S7].
Regional geography and equipment demand concentration
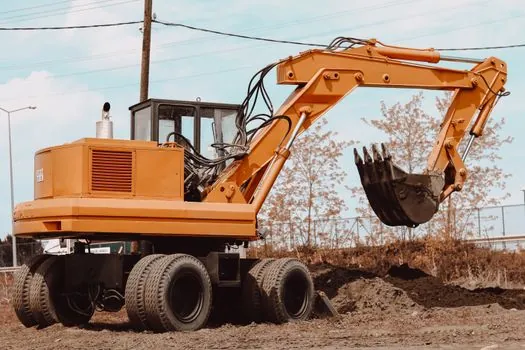
Asia Pacific held 41.3% of global ground improvement service revenue in 2025, the single largest regional share [S1], and the same region leads the soil testing equipment market with over 35% share in 2026 [S2]. The construction equipment parent market shows the same pattern, with Asia Pacific at 44% of 2025 global share and the earthmoving segment at 52% of equipment type revenue [S4].
For Middle East demand, the data flags Saudi Arabia and the UAE alongside Kuwait and Qatar as named ground improvement technology markets, driven by NEOM and adjacent Gulf infrastructure programs [S1][S3]. Europe is forecast to be the fastest-growing construction equipment region through 2035 [S4], while North America is the fastest-growing region for soil testing equipment through 2033, supported by precision agriculture adoption and infrastructure-linked geotechnical testing [S2].
Equipment categories and process-engineering selection criteria
Choosing ground improvement equipment comes down to four hard criteria that line up with the technique taxonomy: soil type (cohesive vs cohesionless), depth of treatment, required bearing capacity or settlement tolerance, and site access for plant. Mechanical compaction equipment (vibratory rollers, impact compactors, rapid impact compaction units) suits cohesionless fills and shallow improvement to roughly 6 m depth, which aligns with the 34.2% service-revenue share this technique commands [S1].
For deeper treatment, the equipment set shifts to vibro-probes and vibroflots for vibro-compaction of loose sands, deep soil mixing rigs for soft clays, and jet grouting columns for water-bearing or contaminated ground [S3]. A comparison frame for specifiers:
Vibro-compaction (stone columns / vibroflots): best for loose granular soils to 30 m, delivers high bearing capacity uplift, requires crane-supported power pack. Deep soil mixing: handles soft clays and organic soils, treats in-situ via shaft-mounted augers, binder dosing is the key control variable. Dynamic compaction: drop-weight technique for fills and loose deposits, 10-30 m depth, no binder needed, vibration nuisance must be managed near existing structures. Jet grouting: high-pressure fluid cuts and mixes in-situ, handles mixed fills and contaminated ground, premium cost tier, geometry of columns is design-critical [S1][S3].
Real-time monitoring and data-driven compaction control are the near-term technology overlays that the service-market report flags as shortening project timelines and reducing material waste [S1]. On the broader construction equipment side, AI-driven predictive maintenance and machine automation are the matched trends at the parent-market level [S4][S5].
Drivers, constraints, and failure modes in 2026

The demand drivers line up across datasets: urbanization on marginal ground, megaproject infrastructure spend (NEOM, Bharatmala, the US Infrastructure Investment and Jobs Act), seismic liquefaction mitigation work in Japan, Turkey, New Zealand and the western US, and climate-driven insurance requirements for demonstrable soil treatment [S1]. The supply-side constraints are consistent: stricter environmental policies on binders, and the cost-premium of electrified and semi-autonomous heavy equipment that the heavy construction equipment market is now starting to absorb [S5].
Common failure modes in service execution that show up in the data: under-dosing of binder in chemical stabilization, inadequate probe spacing in vibro-compaction leading to untreated zones, and missing real-time QC data when insurance underwriters demand it [S1]. On the equipment side, the parent construction equipment market is leaning into predictive maintenance to cut unplanned downtime, which directly benefits ground improvement plant where rigs are often remote and time on site is the dominant cost [S4][S5].
Competitive landscape and who the buyers actually are
Keller Group led the 2025 service-market competitive landscape with the broadest global service portfolio [S1], while Verified Market Reports lists MRCE, CNC Foundations, ALLU, Haley & Aldrich, Ground Developments Ltd, Dieseko Group, KASKTAŞ, ASO Foam Crete, Menard, Griffin Soil Group, LANDPAC, Raito Kogyo, Toho Chikakoki, Geotech Services, Legacy Foundations, and Entact as named players across the technology segment [S3].
Buyers split into three groups: public infrastructure clients (transport ministries, port authorities, rail agencies) tied to megaproject spend, private developers on reclaimed or brownfield land, and industrial operators with brownfield capex cycles [S1]. For procurement teams, the practical decision is rarely brand-loyal: it is whether the contractor can deliver the technique, the QA data, and the binder specification to the insurer and the local code, with equipment selection flowing from that package. The equipment OEMs themselves sit one tier below these contractors in the value chain, which is why the equipment-only US$241 million 2025 base is so much smaller than the US$9.8 billion service market reading for the same year [S1][S6].
Trackable signals worth watching through 2026: the next revision of the verified equipment-market forecast (the March 2026 release anchored the US$301 million 2032 number [S6]), Asia Pacific service-market share movement off the 41.3% 2025 base [S1], and the take-up rate of automatic and on-site soil testing hardware flagged as the fastest-growing automation segments in the soil testing equipment forecast [S2].