
S2 gives 85% as the world-class OEE benchmark, 60% as typical manufacturing OEE, a manual reporting lag of 24–48 hours, and an automated-payback window of 6–12 months.
The gain comes from capturing short stops, cycle-by-cycle speed loss, production counts, and state changes that hand-keyed shift records often omit [S1][S2][S3].
Accuracy gain: measured OEE becomes more complete
The formula does not change between collection methods: OEE equals Availability multiplied by Performance and Quality [S2]. The difference is the quality and completeness of the time, count, and good-part inputs used in that calculation [S1][S2].
S2 describes manual OEE reporting as lagging reality by 24–48 hours and distinguishes the manual and automated approaches by the honesty and granularity of their inputs. Expressed as a relative increase, the midpoint comparison is 77.5% for manual capture and 97% for automated capture, a 19.5 percentage-point increase and roughly a 25% higher accuracy result on that midpoint basis.
The 11-point availability difference is caused by visibility, not by deterioration in the line during the comparison shift.
Short stops: the largest hidden-error category
Manual systems commonly miss events shorter than about 15 minutes, while automated machine signals can record stops in seconds [S5]. In one illustrative shift with 435 minutes of planned production time, the logbook contains 52 minutes of stops, direct measurement records 94 minutes, and the unrecorded difference is 42 minutes [S5].
That example produces 88.0% availability from the logbook and 78.4% from measured downtime, a 9.6-point difference [S5]. The source also notes that plants believing they operated at 70% OEE often move into the fifties after short stops become visible, which means the apparent decline reflects previously uncounted loss rather than a production regression [S5].
In food plants, cumulative micro-stops can hide more than 30 minutes of lost time per shift [S4]. A filler pause of four seconds repeated 40 times in one shift consumes 160 seconds, but manual reporting may record no individual event. Automated capture therefore changes both event frequency and duration accounting, not merely the precision of a handwritten time.
Manual versus automated across decision criteria

Manual collection has the lower setup cost because it requires no PLC integration, gateway, or automated platform [S1][S3]. It is also reasonable for a small number of machines with long cycles, while automation becomes more valuable above roughly 10 machines or on cycles under a few minutes [S5].
The table matters because accuracy is not a single laboratory percentage in everyday plant use. It combines event coverage, timing, count integrity, latency, and the consistency of the record across operators and shifts [S2][S5].
Food plants can reveal a 15–25 point OEE gap
Food and beverage plants switching from clipboard-and-spreadsheet tracking to automated measurement commonly see their OEE fall by 15–25 points, even though the line has not physically changed [S4]. This difference is attributed to unrecorded micro-stops, changeover overruns, reduced-speed operation, and startup scrap [S4].
One documented changeover pattern illustrates the mechanism. A 20-minute overrun above the standard changeover time may be entered as the standard duration because that is what the paper form expects [S4]. In food plants, manual OEE tracking underreports micro-stops and changeovers by 15–25 points, including a changeover that ran 20 minutes over standard but was logged at standard.
Startup scrap and fill-weight giveaway can also be rounded away by shift-end estimation [S4]. Automated collection cannot determine every quality cause by itself, but direct good-count and reject signals reduce the need to reconstruct production totals from memory.
Use cases where automation changes the decision
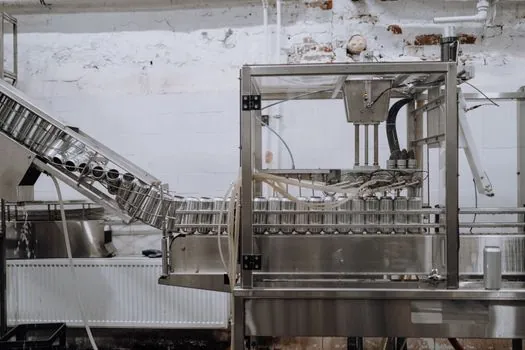
Automated collection is most useful when the decision depends on events lasting seconds, cycle-level speed variation, or a defensible comparison among many machines and shifts [S1][S2]. Direct machine states support availability calculations, actual cycle times support performance calculations, and production counts support quality calculations without requiring an operator to reconstruct them after the event [S1].
The approach also supports live corrective action rather than weekly reporting. Manual data can arrive 24–48 hours after the shift, while automated systems can surface events during the shift and prevent a short stop from becoming an entire unmeasured availability loss [S2]. This is the operational basis for using a data logger at machine or gateway level where event evidence must be retained outside the OEE dashboard.
Automation is not automatically superior for root-cause reasoning. A supervisor who witnessed a jam, material defect, or adjustment can provide a richer explanation than a two-selection reason menu [S5]. A hybrid workflow therefore automates counts, timestamps, and machine states while retaining an operator confirmation step for causes and production context [S1][S3].
Limitations, costs, and failure modes
Automated capture does not remove implementation work. Machines must be connected, signals mapped, and feeds validated, and the capital chain includes PLC integration, a gateway, and software [S2][S3]. Poor signal mapping can produce precise but incorrectly classified data, so validation is part of commissioning rather than an optional administrative task.
Automation also depends on equipment connectivity and stable signal semantics. If a controller changes its tag structure or a sensor state is mapped incorrectly, the automated record can remain consistent while misrepresenting the process [S1][S3]. Independent checks against known events are therefore more useful than trusting completeness alone.
Manual collection is cheaper to start and can retain stronger human context, but it creates three recurring risks: delayed availability, incomplete capture of short events, and bias caused by memory and rounding [S3]. It also consumes 15–30 minutes of operator time per shift [S2]. Automated collection removes recurring entry work after installation [S5], while its main limitations are setup effort, connectivity, signal quality, and the design of the reason-code workflow.
How to decide whether the accuracy gain justifies automation
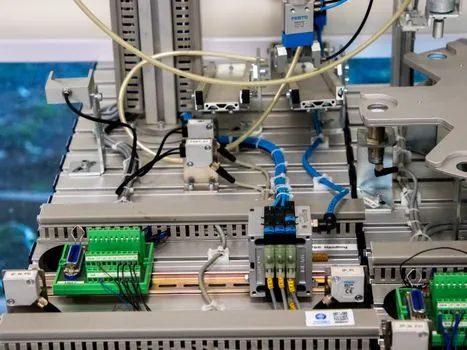
Begin with a one-shift event audit rather than comparing paper OEE with dashboard OEE alone. Record the number and duration of stops below 5 minutes, changes over standard, slow cycles, good counts, rejects, and scrap [S2][S3][S4]. A practical comparison should reconcile planned production time, run time, ideal cycle time, total count, and good count for the same line and shift.
Use the decision thresholds visible in the research. Manual capture is most defensible for a handful of machines with long cycles, while automation gains value above roughly 10 machines or below a few minutes per cycle [S5]. For a plant already moving from shift-end reports to live decisions, event capture can prevent losses from remaining hidden for another shift [S2].
Before implementation, set the baseline expectation with management: OEE may fall by 15–25 points when previously invisible events enter the record [S4]. The correct acceptance test is not whether the new number resembles the old one, but whether direct signals reproduce known stops, counts, and changeovers with traceable timestamps.
The first trackable signal after commissioning is not a higher OEE score, but a reconciliation of missing minutes, recovered event durations, and operator-confirmed reason codes for one representative line.