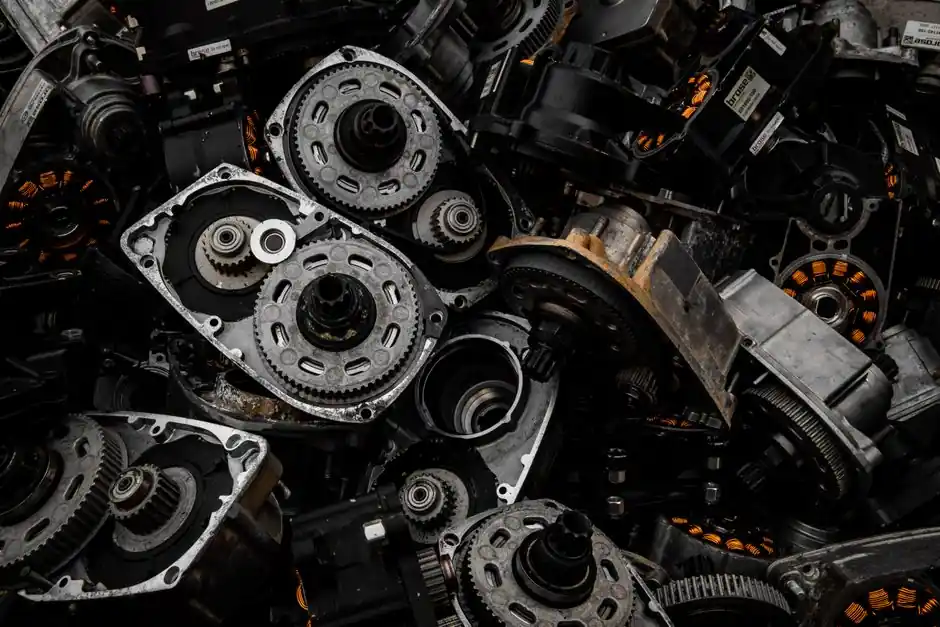
On industrial pumping systems, the upfront purchase price of a typical medium-size unit accounts for only about 10% of its total lifecycle cost over a 15-20 year service life, while energy consumes roughly 40% and maintenance another 25% [S4].
Hydraulic motor procurement sits inside that same economics: the motor is a power-dense rotary actuator whose efficiency curve, fluid cleanliness tolerance, and seal arrangement do more to a plant's cost line than its invoice price, so a TCO model built from the hydraulic motor baseline is the only defensible way to compare competing bids.
Where the Money Actually Goes in a Hydraulic Motor Lifecycle
Lifecycle cost analysis for fluid power equipment partitions spend into five buckets: initial investment, installation and commissioning, energy, maintenance and repair, and downtime plus decommissioning [S4]. For a hydraulic motor driving a winch, conveyor, or auger, the initial-cost share is small because the energy input (electric driver or engine plus hydraulic pump) is the dominant line; the U.S. Department of Energy has long flagged industrial motor-driven pump systems as a 20% mid-range efficiency savings opportunity [S4].
A 2021 fleet study on driver-and-engine TCO quantified the relative weight of each bucket: fuel or energy 25-30%, driver costs (engine, motor, pump) 35-40%, equipment 10-15%, with maintenance, financing, and residual value making up the balance [S5]. Translating that mix to a hydraulic motor cell, the upstream hydraulic pump and prime mover dominate the energy-plus-driver share, which means motor selection that lowers losses or accepts higher speed/pressure envelopes can shift the entire 35-40% bucket.
Direct costs (purchase, freight, install, commissioning) versus indirect costs (downtime, lost production, environmental, insurance) frame the same data in a different cut: direct costs are visible on the PO, indirect costs arrive as line items only after an incident or audit [S6]. A hydraulic motor failure on a plastic-injection clamp typically surfaces as indirect cost three to five times the motor's sticker price in lost throughput per shift, which is why TCO is the only fair comparator.
Energy Cost Drivers: Volumetric and Mechanical-Mechanical Efficiency
Two efficiency terms govern a hydraulic motor's energy bill: volumetric efficiency (internal leakage past the clearances, a function of operating pressure, fluid viscosity, and wear) and mechanical-mechanical efficiency (torque lost to friction in bearings, gears, or piston shoes). At a fixed displacement of, for example, 100 cc/rev running at 350 bar continuous, a 2-3 percentage-point efficiency gap between a premium piston motor and a budget gear motor translates to roughly 2-3% of the input kilowatt-hours wasted as heat across the duty cycle. [S4]
Across a 15-20 year horizon, that gap compounds: because energy typically dominates lifecycle cost, efficiency losses can outrun the price difference between motor tiers well before major maintenance events [S4]. Specifiers chasing a low bid often discover this when the energy line item arrives on the first quarterly utility bill, which is why the Hydraulic Institute/Europump LCC guidebook recommends quantifying a pumping system's entire service-life cost rather than minimising first cost [S4].
Maintenance and Fluid Cleanliness as a TCO Lever
Hydraulic valve, pump, and motor reliability directly drive overall system reliability, and fluid cleanliness is the single most actionable lever a maintenance team can pull on a hydraulic motor [S7]. ISO 4406 particle-count targets in the 18/16/13 to 20/18/15 band are typical for piston motors, and a one-step worsening on the particle count roughly halves the time to a wear-related failure on clearance-controlled spools and slippers.
Maintenance and repair account for about 25% of the 15-20 year lifecycle cost on industrial pumping systems, with the remaining 25% split across operations, installation, environmental compliance, and downtime [S4]. For a hydraulic motor that means bearing replacement, seal refreshes, and case-drain filter changes, each a fraction of the motor's price but cumulatively the second-largest bucket. A hydraulic cylinder on the same machine shares those fluid-cleanliness rules, so a plant-wide cleanliness programme lifts both mean time between failures, see the wider TCO picture in this hydraulic cylinder trade-off map for the spec-first comparison that mirrors the motor decision.
Selection Criteria: Gear vs Piston vs Gerotor vs Vane
Four motor families compete in the mobile and industrial hydraulic motor market, and each maps to a different TCO profile. External gear motors are the lowest first cost, tolerate dirty fluid better than piston designs, and run at peak efficiency only in a narrow speed-pressure window, so they suit low-duty-cycle applications where energy share is small. Gerotor and orbital piston motors sit in the middle on price, offer higher starting torque, and accept moderate contamination but show efficiency drop-off at high pressure above 200 bar. [S4]
Fixed and variable displacement piston motors (axial or radial) carry the highest purchase price and the strictest cleanliness demand yet deliver the best sustained efficiency at pressures of 350-450 bar and continuous duty, which is where the energy share matters most. Across a TCO-weighted scorecard, gear wins on acquisition cost, piston wins on energy and maintenance amortised over a 15-20 year life, and the choice is driven by duty cycle, fluid cleanliness discipline, and whether the application runs more than 2,000 hours per year. A broader spec-first comparison of these trade-offs sits in this hydraulic motor advantages and disadvantages map.
Installation, Commissioning, and the Hidden Direct Costs
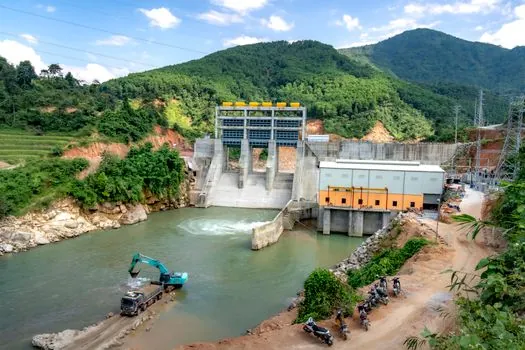
Direct acquisition costs in a TCO model include purchase, freight, foundations, piping, wiring, instrumentation, controls, commissioning, and performance testing [S4]. On a hydraulic motor install the easily forgotten items are case-drain routing (every piston motor leaks 2-6 L/min internally at full pressure, and that flow must return to tank below the oil level), flush-loop or cooler sizing for the heat rejected by inefficiency, and the alignment between motor shaft and the driven load, which is the single biggest cause of premature bearing failure on direct-coupled units.
Performance testing to tighter tolerances costs more at the factory gate but pays back through lower operating expense over the system life, the same logic the Hydraulic Institute/Europump LCC methodology applies to pumps [S4].
Downtime, Spare Strategy, and Risk-Adjusted TCO
Downtime is the indirect cost that turns a routine motor swap into a five-figure event; the standard TCO framework treats downtime as one of the cost factors that, alongside operations, installation, and environmental, makes up the remaining 25% of lifecycle cost outside the energy and maintenance buckets [S4]. For a hydraulic motor in a continuous process, a 4-hour unplanned stop can cost more than the entire motor, so TCO calculations on critical-duty units must add a risk-weighted downtime line, not just the expected mean time between failures.
Spare-parts strategy is the cheapest TCO lever for predictable wear items: keeping one rebuild kit (bearings, seal kit, and shaft seal) on the shelf typically cuts mean time to repair by 60-80% on piston motors and is a fraction of the motor's price. Plants that standardise on a small number of motor displacements across a fleet gain an additional saving because rebuild technicians, test stands, and stock-keeping units all consolidate, a multiplier that does not appear on any single motor's TCO sheet.
Standards, Sourcing, and Total Cost of Ownership Discipline

Reducing hydraulic TCO is not about a single clever purchase; it comes from combining specification discipline, maintainability, and parts support so that energy, maintenance, and downtime are all addressed at the procurement stage [S8]. TCO itself is a financial estimate of all direct and indirect costs over the asset's life, and the value of running the analysis is that it forces trade-offs onto a single comparable axis before the purchase order is signed [S1].
For procurement teams in 2026, the practical sequence is: fix the duty cycle (pressure, flow, hours per year, contamination environment), score each candidate motor family on acquisition, energy, maintenance, and downtime using the 10/40/25/25 split, then add a risk premium for non-standard spares and long lead times. TCO discipline applied at this stage, with fluid cleanliness targets written into the spec, generally lowers 15-20 year ownership cost by 15-30% versus a lowest-bid approach, with the energy bucket alone providing most of the upside.
Trackable signals for the next planning cycle include ISO 4406 cleanliness compliance audits on the installed fleet, mean time between failures on the dominant motor family, and a quarterly energy-per-output-hour metric on the largest hydraulic motor cells; plants that publish these three numbers typically close the gap between predicted and actual TCO within two budget cycles.