The global industrial catalysts market is valued at USD 23.57 billion in 2026 and is projected to reach USD 36.03 billion by 2035 at a 4.81% CAGR, according to the September 2026 market sizing [S1]. A separate, broader catalyst-market scope puts the figure at USD 45.8 billion in 2026 rising to USD 61.5 billion by 2033 (CAGR 4.3%), reflecting different product coverage between the two reports [S2].
Three structural data points frame the 2026 picture: North America held more than 46% of 2025 revenue [S1], heterogeneous catalysts carried over 60% of 2025 revenue [S1], and chemical synthesis applications generated over 61% of 2025 demand [S1]. Asia Pacific is forecast to expand at the fastest CAGR over 2026 to 2035 [S1], reshaping where new capacity and supply contracts are signed. These figures matter for specifiers because catalyst selection, supply security, and qualification cycles are increasingly region-coupled with industrial coating and process-equipment refurbishment programs that run on similar inspection cadences.
Market Sizing: Two Reports, Two Boundaries, One Direction
Precedence Research sizes the industrial catalysts segment at USD 22.53 billion in 2025, USD 23.57 billion in 2026, and USD 36.03 billion in 2035, a 4.81% CAGR [S1]. Grand View Research tracks the wider catalyst market at USD 43.6 billion in 2025 and USD 45.8 billion in 2026, expanding to USD 61.5 billion in 2033 at 4.3% CAGR [S2]. The USD 22 billion gap is scope, not contradiction: Grand View includes emission-control and mobile-source catalysts, whereas Precedence focuses on industrial-process catalysts used in refining, petrochemicals, and chemical synthesis [S1][S2].
For buyers, the 2026 base figure of USD 23.57 billion [S1] is the more useful planning anchor when scoping refining, hydroprocessing, and ammonia/methanol catalyst budgets. Forecast periodicity differs: 2026 to 2035 (9 years, Precedence [S1]) versus 2026 to 2033 (7 years, Grand View [S2]), so CAGR comparisons must align horizons before being quoted in committee.
Type Split: Heterogeneous vs Homogeneous vs Enzymatic/Bio
Heterogeneous catalysts held over 60% of 2025 revenue, while the homogeneous segment is expected to expand at the fastest CAGR through 2035 [S1]. The dominance of heterogeneous systems reflects fixed-bed reactor economics in petroleum refining, hydrocracking, and large-scale petrochemical production, where ease of separation, regenerability, and continuous operation are decisive [S1].
Homogeneous catalysts remain preferred in fine-chemical, pharmaceutical, and asymmetric synthesis routes, where selectivity, mild conditions, and single-site control outweigh separation cost. By material, the chemicals sub-segment held a 62% share in 2025 [S1], anchored by zeolites, supported metals (Pt, Pd, Ni), and metal oxides (V, Mo, W on oxide supports) used across FCC, hydrotreating, and oxidation [S1]. Demand-side pressure from pharmaceutical synthesis and renewable-feedstock processing is pulling the homogeneous and bio-catalyst sub-segments harder than the heterogeneous base.
Regional Map: North America Leads Today, Asia Pacific Wins the Next Decade
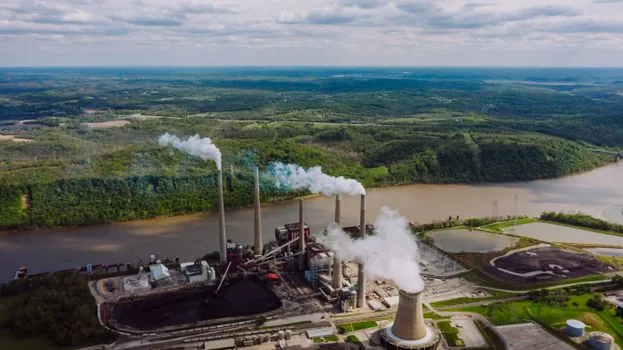
North America contributed more than 46% of 2025 industrial-catalyst revenue, while Asia Pacific is forecast to record the fastest CAGR between 2026 and 2035 [S1]. The regional pivot has direct procurement consequences: Asian refining and petrochemical build-outs in China, India, and Southeast Asia are pulling FCC, hydrotreating, and methanol catalyst demand, while North American buyers are refocusing on renewables, biofuels, and chemical-recycling catalysts [S1][S3].
For process engineers, regional share does more than re-rank suppliers; it shifts lead times, regulatory alignment, and qualification protocols. Buyers tied into the SCADA demand curve through 2030 will notice that Asia-led catalyst capacity additions correlate with new-build DCS/control-system refresh cycles. Expect 12 to 24 month qualification queues at any tier-1 Asian refiner for high-volume FCC or hydrocracker catalyst trials.
Application Pull: Chemical Synthesis, Petrochemicals, Refining
Chemical synthesis held over 61% of 2025 application revenue, while the petrochemicals sub-segment is expected to grow at the fastest CAGR through 2035 [S1]. The 2026 trend package flags three demand drivers: energy-efficient catalysts, broader heterogeneous adoption, and rising use across petroleum, chemical, and pharmaceutical synthesis applications [S3].
Petrochemical growth is the structural tailwind. Plastics and polymer demand feeds FCC, steam cracker, and Ziegler-Natta / metallocene polyolefin catalyst consumption, with the polypropylene Industry 4.0 adoption map reflecting the same downstream capacity additions. Refinery-side catalyst cycles remain tied to hydroprocessing unit uptime, where a 1 to 3 year cycle between catalyst changeouts is the working assumption on hydrotreater and hydrocracker beds.
Cost & Energy Pressure: Process Efficiency Is the Spec Driver
Energy-cost volatility and tightening environmental rules are steering 2026 catalyst R&D toward lower-temperature activity, longer cycle life, and tolerance for renewable or variable feedstocks [S1][S3]. The 2026 trend list explicitly identifies energy-efficient catalysts and heterogeneous systems as the primary forecast themes [S3].
On the ground, this means buyers should track three quantifiable spec axes when tendering: target weighted hourly space velocity (WHSV) at fixed conversion, cycle-length warranty in months or barrels processed per pound, and tolerance for bio-feed blends (e.g., used cooking oil, pyrolysis oil) in hydroprocessing units. Catalyst suppliers able to guarantee cycle life above 24 months on hydrocracker beds, or to maintain conversion at 20 to 30% renewable feed co-processing, are where 2026 contract premiums sit. These same plants often share inspection workflows with industrial borescope routines during catalyst loading and bed-top inspections.
Standards, Sustainability, and Failure-Mode Watch
Catalyst sustainability is now a procurement gate, not a marketing line. Strict environmental regulations are explicitly cited as a 2026 to 2035 growth driver, forcing suppliers to reformulate away from hexavalent chromium, certain cobalt species, and other restricted substances, while developing regenerable and reclaimable spent-catalyst pathways [S1]. Green-chemistry adoption and renewable-energy emphasis are also flagged as growth factors in the same outlook [S1].
Process-side failure modes specifiers should pressure-test in 2026 tenders: catalyst poisoning by sulfur, nitrogen, and trace metals (Ni, V, Fe) on hydroprocessing feeds; coking and coke-induced pressure-drop runaway on FCC and reformer beds; and mechanical attrition / dusting under high-throughput loading, which shortens cycle life and trips reactor pressure-differential interlocks. Buyers are advised to require suppliers to publish lot-level attrition index, surface area (BET), and metal-dispersion data, and to align spent-catalyst take-back with industrial ceramic and support-media recycling streams already established in FCC and SCR operations.
2026 Watchlist: Indicators to Track
Two trackable signals will tell you whether the 4.81% CAGR base case is holding. Second, refinery and petrochemical capex disclosures tied to renewable-feed co-processing units, since each co-processing retrofit typically pulls a 5 to 15% catalyst-volume uplift on first cycle [S1][S3]. If both signals hold through Q4 2026 reporting, the USD 36.03 billion 2035 base case [S1] looks conservative rather than aspirational.