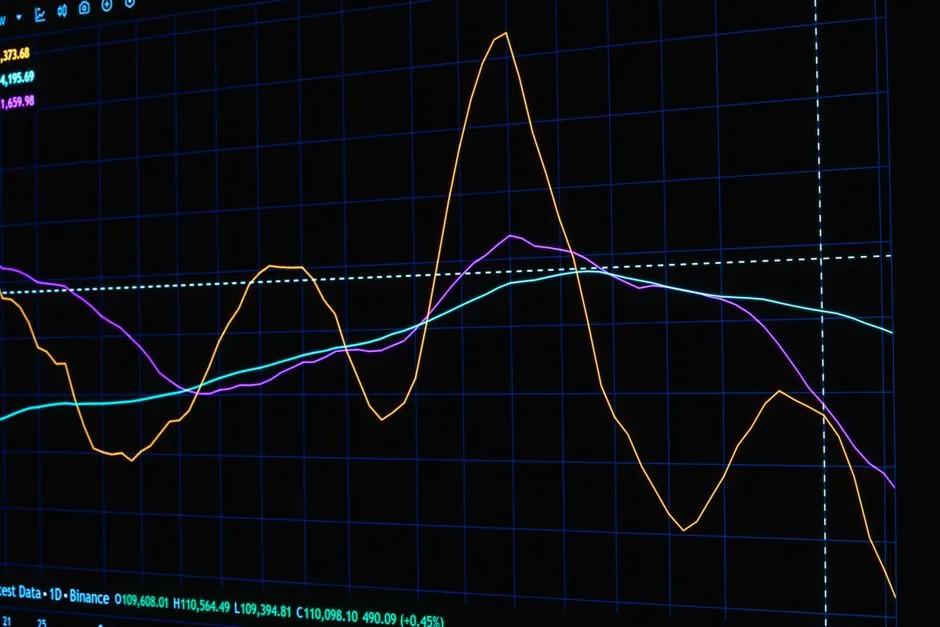
The global industrial filtration market in 2026 carries at least four independent 2026 size estimates: USD 37.88B [S3], USD 40.34B [S1], USD 45.64B [S4], and a 2026-target reading of USD 48.52B [S5], with a longer-horizon USD 20B figure sitting in a narrower "industrial filters" subset [S8].
Forecast CAGRs across the same cohort cluster between 5.42% and 6.8% for the 2026-2030/2035 horizon [S1][S3][S4], while the air-only slice of the market is tracked separately at USD 7.1B in 2026 growing to USD 10.8B by an unspecified later year [S2]. Readers who spec industrial filter skids should anchor on the underlying scope before adopting any one headline number.
Where the 2026 Size Estimates Diverge
The 2026 industrial filtration market size is reported as USD 40.34B by Fortune Business Insights [S1] and USD 45.64B by Precedence Research [S4], while The Business Research Company [S3] reports USD 35.46B for 2025 and USD 49.36B projected for 2030. The spread is driven primarily by what each publisher counts: pure filtration equipment and media, full turnkey systems including housings and skids, or aftermarket service revenue. A separate Fortune Business Insights figure cited via Acme Mills projects the market "to reach USD 48.52 Billion by 2026" on a 4.3% 2019-2026 CAGR, which sits on a different historical base of USD 34.79B in 2018 [S5]. Market Research Future's narrower "industrial filters" scope lands at USD 20B by 2026 [S8], roughly half the broader-market figures, confirming that scope is the dominant variable.
Grand View Research tracks the air-only sub-segment at USD 7.1B in 2026, scaling to USD 10.8B later in the forecast [S2], while Maximize Market Research puts the broader air-filters market at USD 17.96B in 2025 on an 8.02% CAGR [S6]; both exclude liquid process filtration, so they are not directly comparable to the all-media totals above. Engineers building capex models should pin every figure to a stated scope (air vs liquid vs both; equipment-only vs systems) before averaging across publishers.
Product and Media Breakdown Driving the Spend
The Business Research Company breaks 2025 industrial filtration by product into bag filter, filter press, cartridge filter, depth filter, drum filter, electrostatic precipitator, ULPA, and HEPA, and by filter media into activated carbon/charcoal, fiberglass, filter paper, metal, and non-woven fabric [S3]. The same report attributes historic growth to industrial safety regulations, expansion of manufacturing facilities, demand for equipment protection, growth of oil and gas processing, and adoption of dust collection systems [S3]. On a 2026-vintage base, the HEPA and ULPA product classes are the price-per-unit ceiling of the catalog, typically specified for cleanroom, pharmaceutical, and semiconductor air-handling units; cartridge and bag filters sit at the high-volume, replacement-driven end of the spend mix.
Precedence Research splits the demand side by medium rather than product: the air segment held 46% market share in 2024 with a 7.2% forecast CAGR, while the liquid segment carries a 5.7% CAGR over 2025-2035 [S4]. The faster air growth is consistent with tightening indoor-air-quality and emissions codes in North America, Europe, and parts of Asia, where HEPA retrofit and continuous-emission-monitoring (CEMS) particulate stages are now part of standard plant design. Liquid-side growth is paced more by chemicals, pharma water-for-injection, and food-and-beverage throughput, where filter lifetime and change-out cost dominate total cost of ownership. For reference across the broader process-skid family, see the lighting-equipment and electric lamps and lamps and light fittings taxonomy pages, which illustrate how a single industrial catalog splits a product domain by media, application, and enclosure rating, a structure the filter market mirrors but does not yet consolidate.
Regional Split: North America Still Leads, Asia Sets the Pace
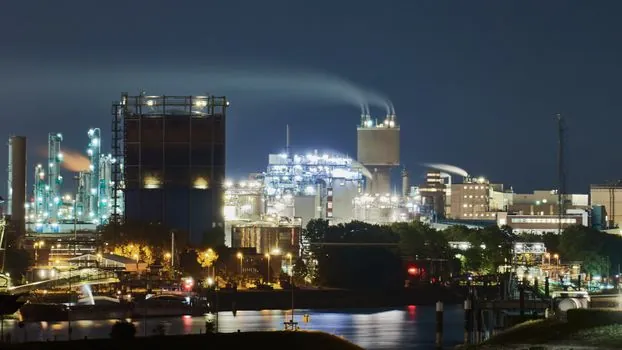
Precedence Research puts North America's 2025 share at 41%, the largest regional block, with Germany tracking a 6.1% CAGR, Canada 6.3%, and Japan 4.3% over the 2025-2035 window [S4]. The Business Research Company likewise names North America as the largest region in 2025 [S3]. The 2018 North America revenue reading of USD 16.28B cited via Acme Mills is now well below current 2025 totals, which themselves fall in the USD 35-45B range across publishers [S3][S4][S5], consistent with the regional share drifting toward a more balanced split as Chinese, Indian, and Southeast Asian chemical and power capacity comes online.
For the heavy-industry end-user mix, the demand drivers named across reports converge: food and beverage, chemicals and petrochemicals, power generation, oil and gas, pharmaceuticals, metal and mining, and automotive [S3]. Semiconductor and electronics fabs, plus healthcare cleanrooms, are added in the Fortune Business Insights scope [S5]. Power generation and oil and gas remain the largest single buyers of high-capacity liquid and gas coalescer / separator stages, while pharmaceutical and semiconductor lines drive the HEPA / ULPA ceiling pricing. The pre-2026 baseline (USD 34.79B in 2018 per [S5]) and the 2025-2026 readings (USD 35.46B to USD 45.64B) imply a step-change between the 2018-2022 window and the post-2023 expansion phase, largely on the back of post-pandemic reshoring of pharmaceutical capacity and tightening US/EU air permits.
Selection Criteria: Matching Filter Class to Application
Specifying an industrial filter stack requires aligning four axes: medium (air vs liquid), media (activated carbon, fiberglass, non-woven, metal, filter paper, combination), product class (bag, cartridge, depth, drum, electrostatic precipitator, HEPA, ULPA, filter press), and the governing standard set for the end industry [S3]. A chemicals/petrochemicals project typically anchors on NACE MR0175 for sour-service metallurgy, ASME B16.5 / B16.34 for housing and valve interfaces, and API 6D for any inline isolation, while a pharmaceutical / semiconductor line will instead reference ISO 14644 cleanroom classes, FDA 21 CFR parts 210-211 for drug products, and EPCM documentation for the HEPA / ULPA final stage. The right "filter type" decision flows from the most binding code, not the lowest sticker price, because retrofit cost on a wrong-rated housing routinely exceeds the original equipment cost 2-3x once downtime, change-out labor, and validation are included.
The three classes are not substitutes: a pharmaceutical terminal stage must be HEPA regardless of bag-filter upstream cost savings.
Limitations, Failure Modes, and What's Missing From the Headline Numbers

The 2026 size estimates do not reconcile to a single number, and the spread is not noise: scope, base year, currency, and inclusion of aftermarket services each move the figure. The Business Research Company's USD 37.88B in 2026 is on a USD 35.46B 2025 base [S3]; Precedence's USD 45.64B in 2026 is on a USD 43.38B 2025 base [S4]; the USD 48.52B 2026 target in [S5] is on a 2018 base of USD 34.79B and a 4.3% 2019-2026 CAGR, which compounds to roughly USD 48.5B and is internally consistent but is the oldest methodology in the cohort. Engineering teams that average across publishers without unifying scope will overstate or understate capex baselines by 10-20%.
Failure modes the headline forecasts do not capture: filter housing fatigue and gasket cold-flow on cyclic-temperature services (a recurring plant-insurance claim driver), media migration on the first 50-100 hours of a new cartridge (which can spike downstream particle counts in pharma water loops), and differential-pressure sensor fouling on bag-house housekeeping lines. The shift toward digital monitoring and continuous-emission systems is named as a 2026-2030 trend in [S3], but none of the publishers publish a per-node sensor pricing curve, so a fully digital filter skid is still scoped on a project basis rather than off a published price book. For a comparable spec-anchored look at a different industrial product domain, the abrasives competitive landscape 2026 reference applies a similar scope-first reading to the abrasives market and is a useful parallel for capex teams that have to defend a single number to a steering committee.
Standards, Sourcing, and Trackable Signals
The standards most often cited for industrial filter specification in 2026 are ISO 16890 (general ventilation air filter classification, superseding EN 779), EN 1822 (HEPA / ULPA), ISO 14644 (cleanrooms), ASME B16.5 / B16.34 (pipe flanges and valves for housing interfaces), NACE MR0175 (sour-service materials), and FDA 21 CFR 210-211 (pharmaceutical GMP), with OSHA 1910 subpart Z and EPA NESHAP governing the air-emissions side. The Business Research Company 2026-2030 forecast specifically attributes growth to environmental sustainability mandates, smart factory implementation, demand for energy-efficient filtration, growth of industrial automation, and tightening air quality norms [S3], all of which point to the same spending nodes: HEPA / ULPA retrofits, digital pressure-drop monitoring, and high-efficiency liquid cartridges for pharma and semiconductor water.
Two signals worth tracking into 2027: the next round of EPA NESHAP revisions for industrial process air, and the post-2026 capacity additions in Chinese and Indian pharma and semiconductor fabs, which together set the floor on the air-segment 7.2% CAGR in [S4] and the liquid-segment 5.7% CAGR. Specifiers who need a single source of truth for the next budget cycle should pick one publisher scope (The Business Research Company for product-class detail, Precedence for media and regional CAGR, Fortune Business Insights for end-user application mix) and apply its base year consistently rather than blending across cohorts. A practical spec reference for a different filtration-adjacent industrial category, lamps and light fittings, shows how a fragmented catalog still has to be normalized to a single rating system before any multi-vendor comparison is defensible, and the same logic applies to HEPA / bag / cartridge mixes in a 2026 capex review.