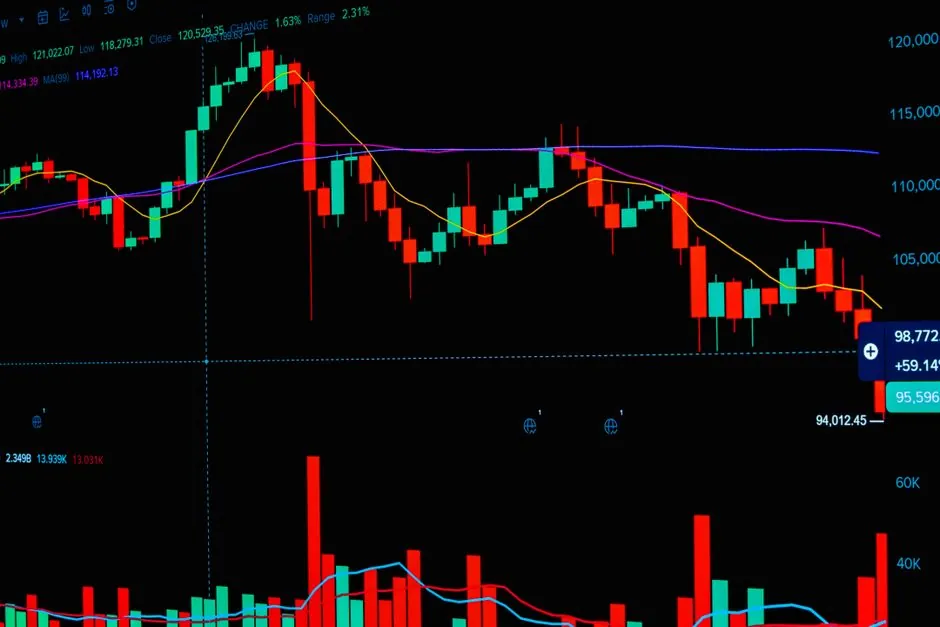
The decline came after an unusually strong 2026: the global lithium carbonate average through November was $20,845/tonne, versus $10,059/tonne for full-year 2025 [S2].
2026 sits between a recovery and a reversal
The 2026 cycle is not a simple repeat of the 2022 peak. Lithium spot prices had more than doubled from their 2025 lows and traded above $20/kg by June 15, 2026 [S3].
That recovery was followed by a marked second-quarter correction. Lithium prices were volatile in Q3 2026, falling in July, recovering in August, and then dropping sharply in September.
Peak-to-trough behavior resembles prior commodity corrections
The previous lithium cycle peaked in December 2022, when acute supply-chain anxiety and aggressive automaker procurement priced immediate scarcity into the market [S3].
The correction followed as new supply arrived, producing-country intervention slowed expansion, and macroeconomic headwinds weakened demand growth. Capital expenditure was deferred and marginal operations placed on care and maintenance [S3].
In 2026, lithium spot prices recovered above $20/kg by June, while the broader price path remained volatile.
Demand structure has broadened since 2022

Lithium prices were volatile in Q3 2026, falling in July, recovering in August, and then dropping sharply in September as supply concerns and inventory revisions affected the market.
Carbonate, hydroxide and feedstock costs diverged
Benchmark’s index comparison on October 2, 2026 showed the Lithium Carbonate Index at 200.2, down 9.31%, while the Lithium Hydroxide Index stood at 239.87, down 8.22% and the broader Lithium Index at 265.31, down 8.43% [S4].
Feedstock weakness also appeared in the same snapshot. The Cathode Index was 73.32, down 5.04%, while the LFP Index was 229.17, up 4.96% [S4].
The comparison distinguishes material, feedstock and battery-chain performance rather than treating lithium as a single undifferentiated price. Carbonate, hydroxide, cathodes and LFP moved at different rates, so cell and pack costs cannot be inferred from the carbonate price alone [S4].
Cost drivers and procurement exposure

Purchase-price exposure depends on the lithium chemical route, volume, contract timing and delivered logistics. A CNY 90,450/t domestic carbonate reference on November 11 does not establish the delivered cost of hydroxide, spodumene feedstock or a battery cell [S1].
The Q3 correction reduced raw-material costs, but buyers still faced volatility as prices fell in July, recovered in August, and then dropped sharply in September.
Total cost of ownership extends beyond the chemical invoice. Installation labor, energy use, inventory financing, yield loss, cell warranty exposure and the effect of low prices on supplier operating continuity all affect lifecycle economics.
Who fits the cycle, and who should not
The 2026 market is suitable for buyers able to separate spot and contract exposure, qualify multiple chemical grades, and track delivered prices rather than rely on a single carbonate benchmark [S1][S4].
It is less suitable for operations assuming the 2022 scarcity premium will persist or that the 2025 trough defines a stable floor. Spot prices more than doubled from their 2025 lows by June 2026, then retreated sharply [S3].
Lithium converters and battery manufacturers should evaluate feedstock, conversion cost and working capital together. The 2026 conversion-cost structure is addressed in 2026 Lithium Conversion Cost Curve by Feedstock, while contract exposure is detailed in Lithium Carbonate Futures vs Spot: 2026 Decision Guide.
Signals that will resolve the cycle
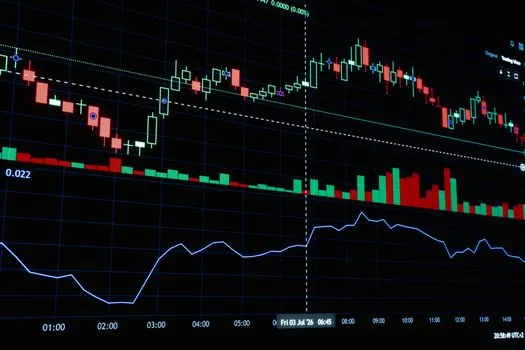
Three trackable indicators will determine whether the Q3 2026 reversal deepens or stabilizes: the direction of EXW China carbonate prices, the monthly rate of change in the lithium carbonate index, and whether inventory revisions continue to pressure spot markets [S4][S6].