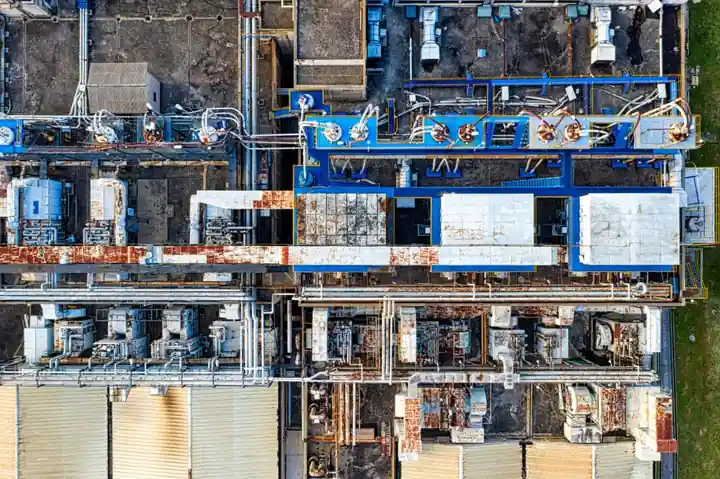
Global LNG capacity reached 511 MTPA in 2025 and is projected to hit 553.16 MTPA in 2026, with a forecast 822.68 MTPA by 2031 at 8.25% CAGR, per Mordor Intelligence [S4]. North America held 32.58% of the LNG market in 2024, while the Middle East and Africa commanded 27.60% of 2025 revenue [S3][S4].
Shell controlled 16.80% of global LNG trading volume in 2025, the single largest company share cited across the available dataset [S4]. Liquefaction plants accounted for 42.60% of infrastructure-type share in 2025, with the segment forecast at 10.75% CAGR to 2031, the fastest infrastructure sub-segment in the dataset [S4].
2025 Market Sizing and Share Anchors
Liquefaction infrastructure led the LNG value chain with 42.60% market share in 2025, ahead of regasification and shipping, while power generation captured 37.70% of end-use demand and marine bunkering is forecast at a 13.55% CAGR through 2031 [S4]. Large-scale plants (>2.0 MTPA) controlled 61.30% of the 2025 LNG market size, while small-scale units are projected at 14.4% CAGR from 2026-2031, the highest growth tier in the segmentation [S4]. The liquefied natural gas market was valued at $131.1 billion in 2025 and is projected to grow from $142.3 billion in 2026 to $371.1 billion by 2033, a longer-horizon view from Grand View Research [S5].
Top Manufacturers and Equipment-OEM Concentration
The LNG liquefaction equipment market is described as relatively concentrated, with the top five producers accounting for 51.24% of revenue in the equipment-side slice tracked by Askci (2024-12) [S1]. Named equipment OEMs in that study include Air Products and Chemicals, Linde Group, ConocoPhillips Company, Atlas Copco, Ingersoll Rand, General Electric, Kobelco Compressors, Chart Energy and Chemicals, Elliott, MITSUI E&S, MCO, and IHI Corporation, with the equipment market valued at $570 million in 2019 and forecast at $620 million by 2024 at ~1.8% CAGR (2024-12) [S1]. The equipment sub-segment splits by type into heat exchangers, compressors, and others, with the compressor tier being the most capital-intensive line item for large-scale trains. flow meter selections for LNG custody transfer typically reference ISO 5167 orifice or ultrasonic primary elements, while pressure transmitter skids are commonly specced for cryogenic service at -162 °C operating conditions.
Regional Capacity Distribution: Where the New Trains Sit
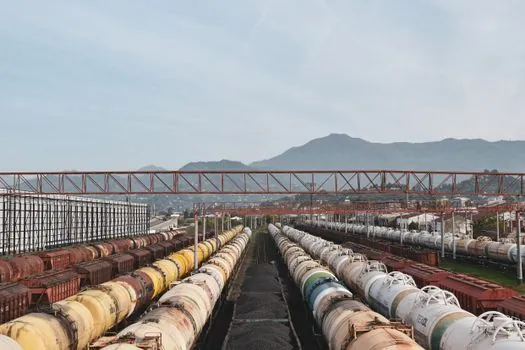
North America's LNG market size reached $26,615.3 million in 2024 and is projected at $44,208.1 million by 2033, a 5.8% CAGR [S6]. U.S. feedgas flows hit an all-time daily record of 19.6 Bcf/d on January 12, 2026, per American Gas Association market indicators dated March 5, 2026 [S7]. The Middle East and Africa region led LNG revenue share at 27.60% in 2025, with Asia-Pacific the demand pull center, where India plans to lift gas consumption 60% by 2030 and Asia-Pacific utilities are adding over 100 bcm of new regasification capacity [S4]. On the equipment OEM side, Asia-Pacific was 31.41% of equipment sales in 2017 in the Askci dataset, the largest regional cluster for liquefaction hardware [S1].
Application Tier: Small-Scale, Mid-Scale, Large-Scale, and FLNG
LNG applications split into four scale bands: small LNG plants below 0.25 MTPA, mid-scale 0.25-2.0 MTPA, large above 2.0 MTPA, and FLNG floating plants, per the Askci segmentation (2024-12) [S1]. Large-scale plants held 61.30% of 2025 LNG market size while small-scale is forecast at 14.4% CAGR to 2031, the fastest scale tier, driven by LNG as a marine bunker fuel under IMO-2020 sulfur cap rules and remote-grid power applications [S4]. The global LNG-fueled fleet grew 33% in 2024 to 638 vessels and is expected to exceed 1,200 ships by 2028, the marine-bunker demand pull behind the small-scale capacity wave [S4]. Driver-impact analysis puts Asia-Pacific gas-to-power projects at +2.50% LNG CAGR contribution and marine bunkering at +1.80%, with floating LNG unlocking stranded fields at +0.90% [S4]. Spec-driven selection for cryogenic industrial valve trim typically references API 6D ball and API 600 gate bodies, with extended bonnets for -162 °C LNG service to keep stem seals above the packing frost line.
Trading Volume and Buyer-Side Concentration
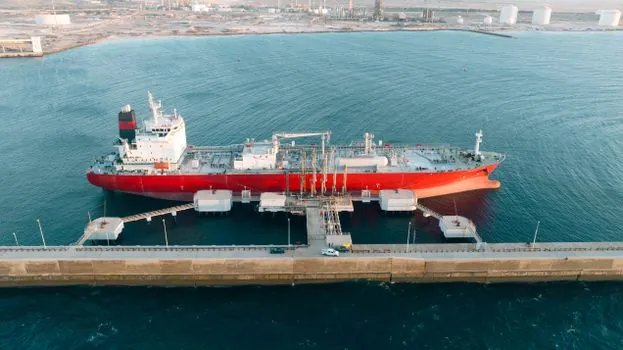
Shell held 16.80% of global LNG trading volume in 2025, the largest single-company share in the buyer-trader segment per Mordor Intelligence [S4]. Long-term offtake contracts are increasingly being coupled directly to power-purchase agreements in Asia-Pacific, lowering financing risk and reinforcing bankability of new liquefaction trains [S4]. Data-center demand for firm low-carbon supply is cited as a +0.6% LNG CAGR contributor on a long-term (≥4 year) timeline, a small but emerging pull on U.S. Gulf Coast export volumes [S4].
Equipment-OEM Selection Criteria and Standards
LNG liquefaction equipment selection is dominated by two product lines: heat exchangers (main cryogenic heat exchanger, MCHE, and coil-wound exchanger, CWHE) and compressors (mixed-refrigerant and propane compressor trains) [S1]. The compressor tier is where the named OEMs above compete most directly, with Kobelco, Mitsubishi, Atlas Copco, and Elliott named in centrifugal and screw compressor frames for mixed-refrigerant service [S1]. Equipment-side revenue CAGR of ~1.8% trails the overall LNG capacity CAGR of 8.25%, consistent with the value-chain shift toward midstream and regasification assets vs. liquefaction hardware [S1][S4]. For a project engineer comparing pressure sensor options for LNG ship and storage tank applications, the spec floor is typically a sealed SS316L inlet with operating temperature down to -196 °C and HART or 4-20 mA analog output, with IEC 60079-series certification for hazardous-area zones on the BOG compressor skid.
Limitations, Watchpoints, and 2026 Signal Nodes
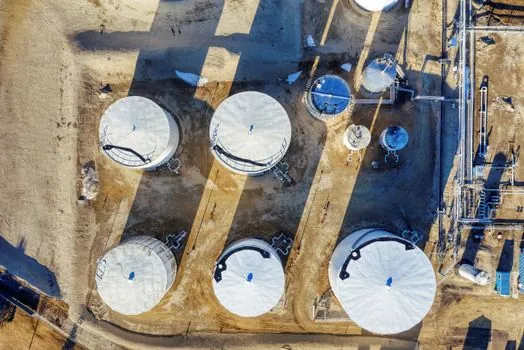
Prolonged EPC inflation and the rise of renewable hydrogen are the two principal watchpoints flagged for the LNG market through 2031 [S4]. The equipment-side dataset from Askci (2024-12) is five years older than the 2026 market-sizing reports, so direct cross-period comparison should treat the 51.24% top-five equipment concentration as a 2017-2019 baseline rather than a 2025 figure [S1]. Tradeable signals to track in the second half of 2026 include U.S. feedgas flow updates from the AGA monthly indicator series, the next FID round for North American and Middle East export trains, and the IMO marine-bunker fleet count versus the 1,200-ship 2028 baseline [S4][S7]. For spec-driven sourcing, the Askci equipment OEM list and the Mordor 2025 share split remain the two most citable anchors until the next 2026 H2 market refresh.
Trackable next nodes: the AGA Natural Gas Market Indicators monthly series for U.S. feedgas records, the IMO marine LNG fleet count versus the 1,200-ship 2028 baseline, and any new FID announcements for Middle East or U.S. Gulf Coast liquefaction trains in Q4 2026 [S4][S7].
Background reading: Crucible Furnace Selection for Telecom Enclosures: Why the Spec is Misframed.