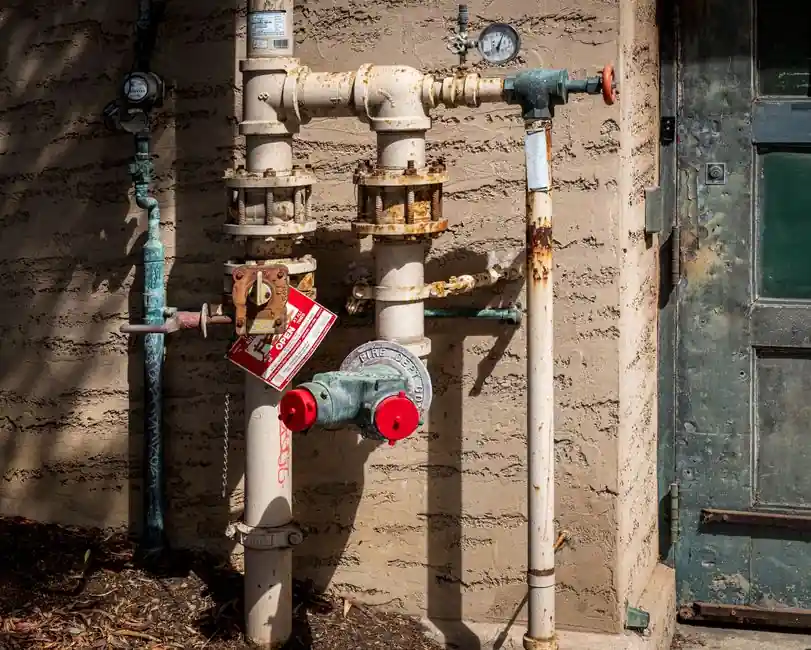
Needle valve Cv charts publish the flow coefficient at each stem position, not just at full open, because the valve's job is to deliver controllable flow across its travel, not maximum throughput.
For fine-metering service, the chart's Cv-vs-turns curve is the primary selection data: the user picks an orifice whose Cv range straddles the required flow at the chosen pressure drop, then verifies that the number of turns between minimum and maximum setpoints is large enough for hand adjustment.
What the Cv Number Actually Means
Cv is defined as the flow of 60 degrees F water in US gallons per minute that passes the valve with a 1 psi pressure drop, so a published Cv of 0.05 means 0.05 GPM at ΔP = 1 psi with cold water [S1][S6]. The same coefficient feeds the working equation Q = Cv * sqrt(ΔP / SG) for incompressible liquids, where SG is specific gravity relative to water at the same temperature [S1][S2].
Published Cv ratings are almost always full-open Cv; the chart is what reveals how the Cv changes between closed and open, which is the whole point of a metering valve. Without a turns-vs-Cv curve, a buyer cannot tell whether a "Cv 0.05" valve achieves 50% flow at half-turn or 95% flow at half-turn, and the difference is the difference between useful metering and a glorified on/off valve [S1][S9].
Reading a Standard Needle Valve Cv Chart
A typical M3-threaded needle-valve Cv chart tabulates Cv at integer stem turns for several orifice sizes, in this case -1- (0.031 in), -2- (0.062 in), -3- (0.094 in) and -4- (0.125 in) orifice diameters [S1]. The smallest orifice climbs from Cv 0.0007 at 2 turns to Cv 0.0190 at 20 turns, while the largest climbs from 0.0236 to 0.2224 over the same range, a roughly 10x spread across the four orifices [S1].
Stem taper is the physical driver: typical needle valves use a 5 to 15 degree included taper, so one full handle turn advances the stem only a fraction of a millimetre and the annular orifice changes by a still smaller fraction, which is why a 20-turn chart can resolve Cv into increments small enough to set flow by hand [S2]. Fine-pitch stem threads, commonly 32 TPI or 40 TPI on instrument-grade valves, multiply the gear reduction between the hand and the seat [S2].
Sizing Worked Example: Acetone at 0.1 to 0.5 GPM
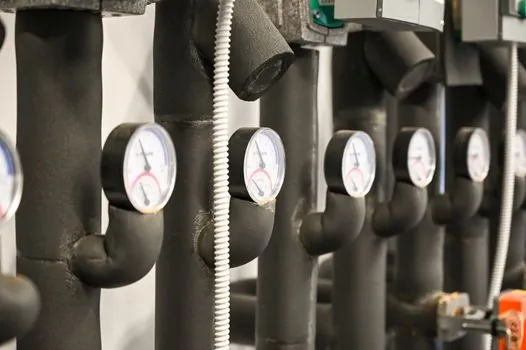
With upstream pressure 100 psia, downstream 60 psia, acetone at SG 0.79, and a target flow of 0.1 to 0.5 GPM, the required Cv range falls between 0.0141 and 0.0703, calculated from Q = Cv * sqrt(ΔP / SG) with ΔP = 40 psi and SG = 0.79 [S1]. The -2- (0.062 in) orifice matches: its Cv hits 0.0141 at about turn 2.3 and 0.0703 at about turn 14.6, leaving roughly 12 turns of metering resolution [S1].
Add a vernier handle readable to 0.1 turn and the same valve exposes about 123 visual reference points across the working range, a resolution most ball and globe valves cannot approach [S1]. This is the practical reason needle valves are specified on burettes, analyzer sample lines and pilot circuits: turn-by-turn repeatability, not raw Cv magnitude, is the specification that matters.
Typical Cv Ranges Across Needle-Valve Categories
Published needle-valve Cv data covers roughly four orders of magnitude. General-purpose instrument needle valves commonly sit in the Cv 0.01 to 1 range, fine-metering stems extend down to Cv 1.0E-4 to 1.0E-2, and larger metering valves can reach Cv 1 to 10 depending on end connection size [S5]. For reference, the Kv ranges of M3 standard-resolution needle valves run from 4.5E-2 to 9.0E-2, equivalent to Cv around 5.3E-2, with high-resolution variants below that band [S4][S8].
The chart format itself is fairly standard across vendors: rows are stem turns, columns are orifice or model variant, and the table cell is Cv (or Kv) at that turn count for that orifice. Beswick's published M3 chart, Ideal Valve's -1- to -4- orifice table, and Swagelok's online Cv calculator all follow the same logic, which makes cross-vendor comparison possible on a like-for-like basis once SG and ΔP are matched [S1][S3][S4].
Needle vs Globe vs Ball: When the Cv Chart Decides It

A needle valve is the right pick when required flow is well below the line-size Cv of a ball or globe valve, typically in the sub-0.5 GPM liquid range or low SLPM gas range, and when the operator needs to hold a setpoint without drift [S2][S7]. A ball valve reaches full Cv in roughly a quarter-turn, so its usable metering range is a narrow slice at partial open; a globe valve gives a more linear Cv-vs-turn curve but is bulkier and more expensive at the same line size [S7].
Selection rules of thumb: pick needle when (1) target flow is under 10% of the line-size ball-valve Cv, (2) the process fluid is clean (a single particle will trash the orifice), and (3) the duty is metering, not frequent open/close cycling [S2][S9]. Skip the needle when the duty is true isolation, when solids or slurries are present, or when a globe or ball will give enough resolution at lower cost [S7][S9]. A review of upstream needle-valve sizing practice and the related needle valve selection guide confirms the same envelope: high turn count, small orifice, clean service.
Failure Modes That Show Up in the Cv Chart
Three failure modes distort a needle-valve Cv chart in service. Over-torquing the handle past finger-tight deforms the stem tip and permanently changes the geometry, so the Cv-vs-turn curve no longer matches the published chart and the setpoint drifts between shifts [S2]. Contamination by weld slag, scale or a stray particle wedges the tapered stem off the seat, collapsing the chart's smooth curve into a near-binary "full or zero" response [S2].
Third, stem-seal leaks after the first thermal cycle: PTFE or graphite packing loosens as the gland nut heats and cools, and the resulting weep changes the effective ΔP seen by the valve body, which the Cv chart assumes is the same as the line ΔP [S2]. For gas service, the same Q = Cv * sqrt(ΔP / SG) form is replaced by a compressible-flow version that includes upstream absolute pressure P1, and at low P1 the Cv chart's behaviour can be non-intuitive, so gas-duty selection should always use the gas formula rather than the liquid one [S1].
Linking Needle Valve Cv to the Wider Flow Loop
A Cv chart only describes the valve; the rest of the loop has to be honest about ΔP. If the upstream regulator, flow sensor and tubing each eat their share of pressure, the ΔP arriving at the needle valve can be a small fraction of the line ΔP, and the flow you actually measure at the flow meter will be lower than the chart predicts. Good practice is to size the valve for the actual ΔP at the seat, not the pump or regulator outlet, then re-derive Q from the corrected number. [S2]
For process skids where the needle valve sits ahead of a metering pump or flow measurement station, the Cv chart becomes one input to a flow measurement error budget: needle-valve setpoint repeatability, pump pulse-to-pulse variation and meter accuracy stack, and the weakest term sets the loop's overall stability. Track the needle valve chart in the same document as the meter calibration so that future troubleshooting has both curves side by side.
Quick Selection Checklist
1) Compute required Cv from Q, ΔP and SG using the standard liquid equation [S1]. 2) Pick an orifice whose chart Cv at mid-travel is closest to the required value, and check that the turn count between minimum and maximum setpoints is at least 8 to 10 turns for hand resolution [S1]. 3) Confirm the stem taper is a matched pair (within ~0.5 degrees) and the tip finish is below Ra 0.4 microns, otherwise the chart Cv will not hold in service [S2]. 4) For gas service, switch to the compressible formula with P1 in psia and verify the chosen orifice does not choke at minimum upstream pressure [S1]. 5) Re-check after the first thermal cycle, because packing slack at temperature can shift the effective ΔP enough to move the operating point off the chart's predicted Cv [S2].
Track the next two signals on needle-valve Cv data: (a) any 2026 update to the Swagelok online Cv calculator's orifice and turn-count coverage, since it is the most-used vendor tool in this category [S3]; (b) any new vendor publication of Kv curves in metric alongside Cv, because the standard Cv convention is still US gallons per minute of 60 degrees F water at 1 psi, and a metric-only chart forces a unit conversion on every spec sheet [S1][S4].
For related coverage, see Rebar Weight Formula D²/162: Derivation, kg/m Chart, Field Use.