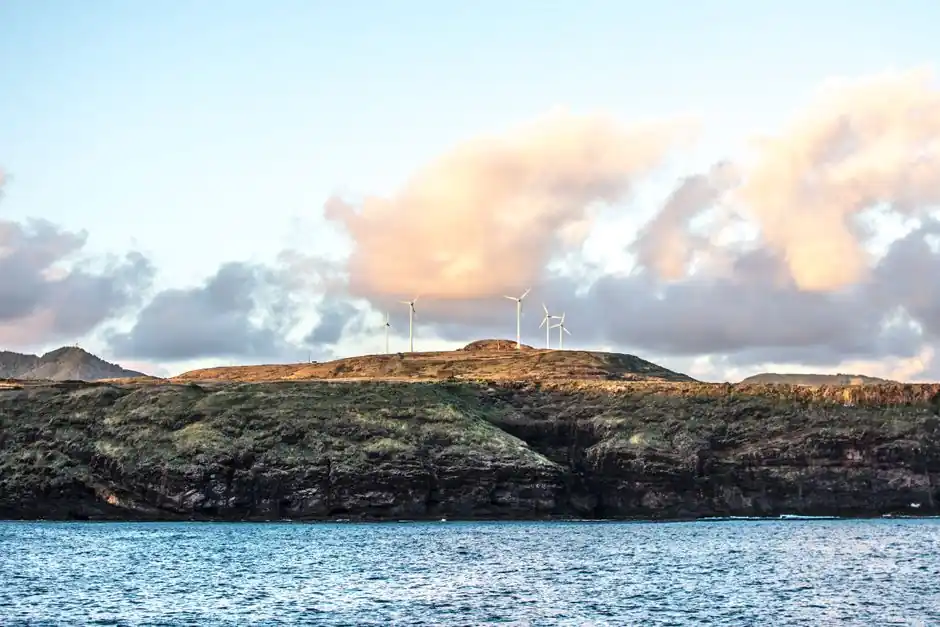
Global offshore wind reached 92 GW of installed capacity by June 2026, with EnergyPulse modelling operational capacity climbing to 230 GW by 2035 [S2]. 2025 closed with 6,773 MW of new capacity connected, and the industry is bracing for roughly 900 turbine installations in 2026, set to be the highest ever [S1][S2].
The competitive map is now defined by next-generation turbines above 13 MW (67% of all units installed in 2025), a record 8.2% global fleet failure rate, eight new jack-up vessels delivered last year, and a fast-emerging floating wind segment that unlocks deep-water markets in Japan, South Korea, Norway, and the US West Coast [S1][S5].
Capacity Trajectory and Market Sizing
The global offshore wind market was valued at $42.3 billion in 2025 and is projected to grow from $45.2 billion in 2026 to $93.5 billion by 2033 [S3]. Europe alone is forecast to expand from USD 14.79 billion in 2026 to USD 26.71 billion by 2034 at a 7.67% CAGR [S8].
Within Europe, the EU had 19 GW of offshore wind at the time of the cited Nature study, with member-state and North Seas Energy Cooperation targets of 60 GW by 2030 and at least 260 GW by 2050 [S4]. The same modelling work warns that large-scale expansion can reduce surface wind speeds by 2–3 m s⁻¹ over the Northwest European shelf, a wake-effect signal that will reshape micrositing on future arrays [S4].
OEM Competitive Map: Siemens Gamesa, Vestas, GE Vernova
Siemens Gamesa installed 62% of all wind turbines in 2025, anchored by the SG 14 platform, with Vestas and GE Vernova following across Europe, APAC, and the United States [S1]. Turbines above 13 MW took 67% of 2025 installations, a clear marker that the industry standard is now in the 14–16 MW class rather than legacy 8–10 MW units [S1].
On-position installation durations lengthened materially in 2025: 3.85 days average, 2.61-day median, and roughly 6.20 days on US projects, where new-market ramp-up and weather windows stretched campaigns [S1]. For spec-driven buyers mapping the broader industrial-supply chain, the same OEM-consolidation pattern shows up in adjacent process-equipment categories like battery cell competitive landscape 2026, where a handful of suppliers set the de facto spec baseline.
Vessel and Foundation Capacity
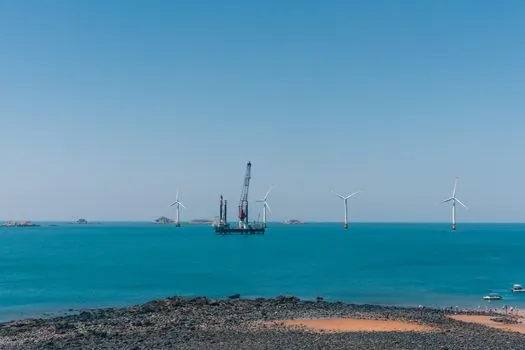
Foundation installation in 2025 totalled 644 monopiles and 145 jackets, with DEME's Orion and Seaway7's Seaway Strashnov leading at 100 and 89 monopiles respectively [S1]. Eight new jack-up vessels entered the fleet in 2025, including four Cadeler units, one DEME vessel, additional APAC tonnage, and a US-compliant vessel for Dominion Energy, materially easing the installation bottleneck that constrained 2022–2024 [S1].
Cadeler installed 230 turbines in 2025, capturing nearly half of global turbine installation activity, with Jan De Nul and DEME rounding out the top three [S1]. This vessel-side concentration mirrors the OEM concentration: three to four players are setting the cadence, the per-day cost basis, and the foundation-handling envelope that every developer must design around.
Reliability, O&M, and the 8.2% Failure Rate
The global offshore wind fleet recorded an 8.2% failure rate in 2025, the highest in more than a decade, with the aging Siemens Gamesa G4 (3.6/4.0 MW) platform hitting 18% in year 12 [S1]. O&M jack-up interventions rose 14% versus 2024 to a record 571 calls, driven by mid-life wear on legacy turbines and early-life teething on newer, larger platforms [S1].
ZITON completed 262 jack-up interventions in 2025, a new sector record, using its expanded six-vessel fleet increasingly deployed on larger turbine platforms [S1]. For process engineers, this is the same shift seen in industrial sensor and HMI touch panel sizing and selection: a wave of new-generation hardware is creating a parallel after-market service opportunity as installed-base complexity outruns in-house O&M capacity.
Floating Wind, Workforce, and Regional Pivot
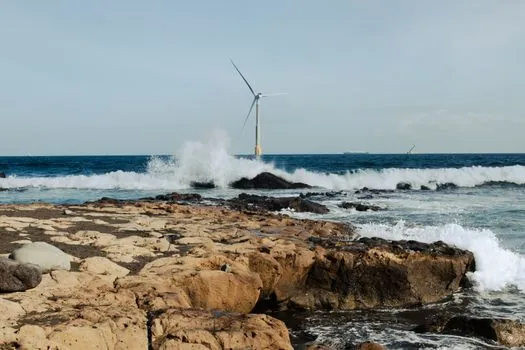
Floating offshore wind is moving from pilot to commercial scale in 2026, unlocking deep-water markets in Japan, South Korea, Norway, and the US West Coast where fixed-bottom monopiles and jackets are impractical [S5]. Costs remain above fixed-bottom, but volume is rising fast as more projects reach FID, and the technology is widely expected to become a mainstream part of the offshore mix within the decade [S5].
Workforce shortage is now a hard constraint: training pipelines did not keep pace with build-out, oil-and-gas crossover is partial, and the projects hitting schedule are the ones that locked in crew and technical staff well before FID [S5]. Regional execution is diverging: US project durations averaged 6.20 days per turbine against a 2.61-day global median, while CESA's IPF 2026 review flags that "project development in the US has slowed, [while] development around the world is only accelerating" [S1][S6].
Who Offshore Wind 2026 Is For, and Where the Spec Risks Sit
This market is for utility-scale developers, Tier-1 OEMs (Siemens Gamesa, Vestas, GE Vernova), foundation installers (DEME, Seaway7, Cadeler, Jan De Nul), and O&M contractors (ZITON) that can mobilise next-gen turbine crews, floating-mooring know-how, and high-capacity jack-up tonnage. It is not for new entrants without a vessel commitment, a foundation-fabrication slot, or a 14 MW+ O&M capability, because the 8.2% failure rate and 571 jack-up calls in 2025 show that execution risk has shifted from manufacturing to through-life service [S1][S5].
Three live watch-items for the rest of 2026: (1) whether the 900-turbine 2026 installation forecast is met given US permitting drag [S1][S6]; (2) whether the first commercial-scale floating projects reach FID without LCOE slippage [S5]; and (3) whether vessel additions in APAC and a US-compliant jack-up translate into shorter US on-position durations in the OEUK 2026 Insight baseline [S1][S7].
Spec-level background on the components involved: pressure transmitter, flow meter, and industrial valve.