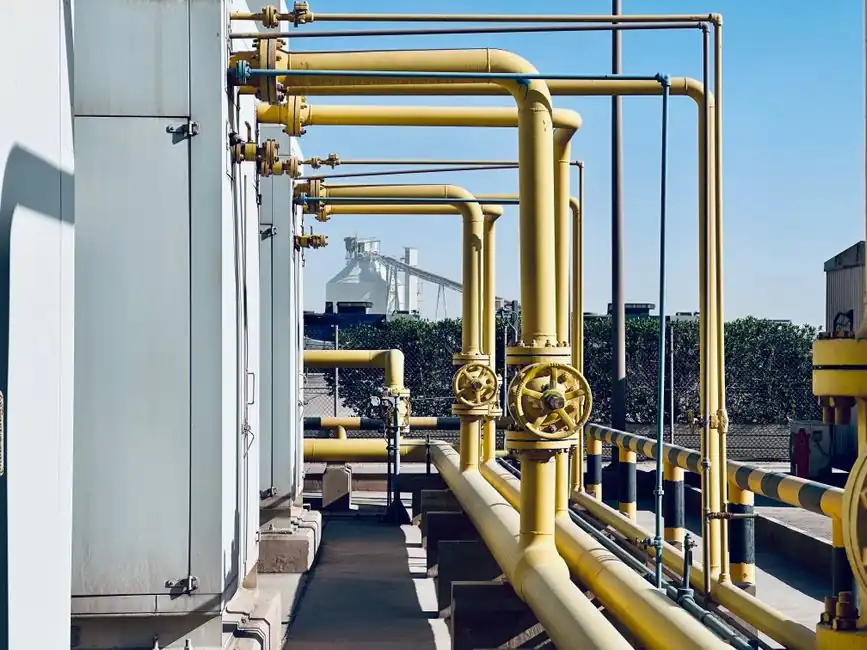
On a process plant balance sheet, the safety relief valve is a fraction of a percent of CAPEX yet routinely decides whether a shift runs or a flare stack lights up, which is why the standard rule of thumb is that initial purchase price accounts for only 10-15% of total cost of ownership for industrial valves, with the remaining 85-90% accumulated through installation, maintenance, energy, and unplanned downtime [S2].
Unplanned valve failures cost $100,000-$500,000 per hour in lost production, and valve failures account for 23% of unplanned manufacturing shutdowns, with the average incident priced at $67,000 [S3]. The valve itself is the smallest line on that bill.
What "TCO" Actually Means for a Safety Relief Valve
Total cost of ownership for a safety relief valve is the sum of acquisition, installation, commissioning, scheduled and unplanned maintenance, energy or emissions losses, and decommissioning over the asset's installed life, calculated on the actual operating envelope, not the catalog nameplate [S2][S5].
Procurement teams that benchmark only invoice price systematically underbid the wrong valve, because safety relief valves are a low-frequency, high-consequence purchase where a single spurious lift or failure-to-open event can consume several years of any unit-price saving [S2][S5]. For a comparable control-valve TCO framework on a different but adjacent product, the pressure reducing valve TCO breakdown runs the same 85-90% logic, confirming the pattern across valve families.
Cost Driver Breakdown: Where the 85-90% Lives
The four TCO drivers that move the bulk of lifetime cost for safety relief valves are installation and commissioning labour, scheduled maintenance and set-pressure re-verification, unplanned downtime exposure, and fugitive-emissions or non-conformance penalties, each behaving differently with valve type and service [S2][S3].
Proactive maintenance runs 3-5 times cheaper than reactive repair, because each avoided unplanned event sidesteps both the direct failure cost and the 23% of manufacturing shutdowns that valve failures cause, where a single hour of lost production ranges from $100,000 to $500,000 depending on process unit [S3]. Installation cost is largely set by body size, end-connection standard, and the need for upstream rupture discs or inlet piping reinforcement, items that are typically decided once and locked in for the life of the asset [S2][S5].
A common procurement trap is the "fit-gap" failure, where a standard Class 1500 catalog valve satisfies the pressure rating but is not matched to the thermal cycling, media, or seat-hardness demand, which is precisely the scenario that drives bonnet leakage and accelerated seat wear, and the resulting rework dominates lifetime cost [S5].
Spring-Loaded vs Pilot-Operated: TCO Crossover at 5-7 Years
Spring-loaded valves still hold 46.55% of the 2025 pressure-relief-valve market by units, and pilot-operated designs are scaling fastest at a 7.44% CAGR toward 2031, so the two architectures will coexist on most plant rosters through the end of the decade [S1]. On pure TCO, pilot-operated units become the lower-cost option once the service horizon exceeds roughly 5-7 years of continuous duty, because the higher first cost is offset by tighter set-pressure tolerance, lower simmer leakage, and longer intervals between bench-set re-verification [S4].
Selection is not absolute: for low-cyclic, clean-service, set-pressure-below-150-psi applications, the spring-loaded valve remains the lower-TCO pick because the operating envelope is well within the architecture's sweet spot and the pilot system's added complexity is not amortised [S1][S4].
Service-Specific TCO Multipliers
By end-use, oil and gas still represents 32.21% of 2025 revenue, and pharmaceutical and biotech demand is climbing at an 8.35% CAGR, which sets the duty envelope that the valve must survive [S1]. Each service class adds a specific cost multiplier: LNG and hydrogen service require materials qualified to –162 °C cryogenic ratings, sour service adds NACE MR0175 compliance, and sanitary pharmaceutical service adds electropolished stainless, traceability documentation, and clean-room rebuild procedures that more than double the per-event maintenance cost of an equivalent hydrocarbon unit [S1].
Set-pressure band also shifts the math. Medium-pressure (150-600 psi) units held 41.07% of 2025 share, the broadest competitive supply pool and therefore the lowest unit price, while high-pressure units above 600 psi are growing at 7.68% CAGR, with fewer qualified suppliers and a markedly higher first cost that must be justified by longer mean time between maintenance [S1].
Specification Levers That Move TCO the Most
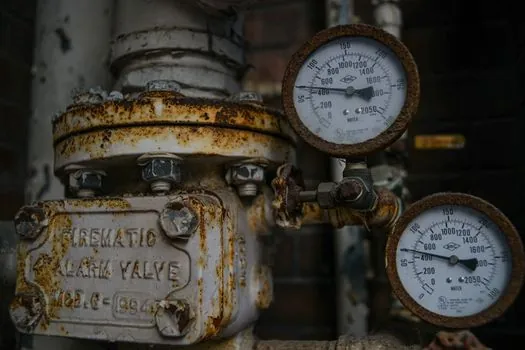
The four specification choices that move safety-relief-valve lifetime cost the most are material class (cast steel vs stainless vs alloy), seat configuration (metal vs soft vs hardened), end connection (flanged vs welded vs integral body), and instrumentation (mechanical only vs HART/IIoT-enabled), each carrying a different maintenance and emissions profile [S1][S2][S5]. Smart, HART- or IIoT-enabled valves are explicitly cited as a +0.7% CAGR driver because they convert scheduled maintenance into condition-based intervention, which in turn lowers the unplanned-downtime share of TCO [S1].
For a worked-example on how material and pressure class move the bill on a different valve family, the needle-valve TCO spec walk shows the same lever pattern at smaller line sizes. Procurement should require bidders to quote a 10-year TCO figure, not a unit price, with explicit line items for installation hours, PM intervals, mean time between repairs, and guaranteed seat-leakage rate, because the same vendor's spring-loaded and pilot-operated offers diverge sharply once those lines are populated [S2][S4][S5].
Failure Modes and Risk-Adjusted TCO
The two TCO-relevant failure modes for safety relief valves are spurious lift (opens below set pressure) and failure to open on demand, and each maps to a distinct cost bucket. Spurious lift drives direct production loss, often the $100,000-$500,000-per-hour band, while failure to open on demand drives incident, regulatory, and fire safety exposure that no spreadsheet can fully price [S3].
Spurious-lift frequency is governed by set-pressure stability, seat quality, and sensitivity to backpressure, all of which are areas where pilot-operated and high-specification spring-loaded valves materially outperform commodity units, and where the 3-5x cost ratio between proactive and reactive maintenance is actually earned [S3][S4]. For plants operating under machine safety and process-safety regulations, the audit-trail value of digital valves with HART or IIoT reporting, plus the reduction in physical set-pressure re-verification trips, often closes the cost gap with mechanical units on its own [S1].
Standards, Compliance, and Sourcing Constraints

The non-negotiable compliance floor is API 526 for flanged steel safety relief valves, with ASME B16.34 governing pressure-temperature ratings and ASME Section VIII controlling unfired pressure-vessel design; these standards are cited as a +1.2% CAGR driver for the global market and are the reason off-shore catalog substitutions rarely survive a safety certification audit [S1][S5].
Sourcing risk is concentrated in two places: high-pressure and large-bore sizes above 6", where supply is tightening as Middle Eastern brownfield revamps lift replacement demand at +0.9% CAGR impact, and qualified cryogenic or hydrogen-service materials, where qualified-vendor lists are short and lead times can stretch to 30-40 weeks [S1]. For new LNG and hydrogen trains, expect pilot-operated or balanced-bellows designs to dominate, while broad refinery and chemical-plant duty continues to absorb spring-loaded units from the existing installed base.