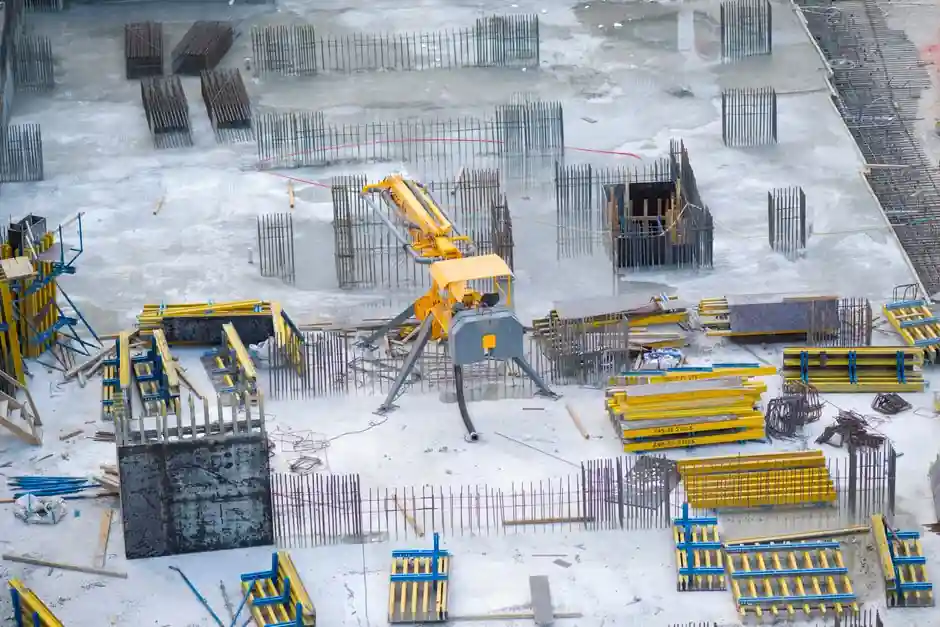
Published 2026 market sizing for steel rebar converges on a 2026 baseline near 152.96 million tons in volume, with value estimates ranging from USD 202.27 billion to USD 258.02 billion depending on methodology [S1][S2][S6]. Across the four major reports surveyed, the 2030–2034 CAGR clusters between 4.4% and 5.89%, with one outlier projection reaching USD 470.93 billion by 2034 off a 2025 base of USD 271.1 billion [S4][S7].
Asia Pacific is the structural anchor, holding a 53% share of forecast-period incremental growth and a 74.1% share of 2025 global value in the most granular breakdown [S1][S5]. North America is smaller but accelerates faster, with the US alone accounting for 85.4% of the USD 27.39 billion 2025 regional market and the segment projected at a 5.72% CAGR through 2034 [S3].
Process Route Split: BOS Still Leads Value, EAF Gains on Scrap Economics
Basic oxygen steelmaking is identified as the value-leading process route for rebar globally in 2026, with the segment estimated to hold the largest market share by revenue [S1]. In North America, the electric arc furnace route already led by volume in 2025, attributed to cost efficiency, energy savings, and rising use of recycled feedstock [S3].
Producers are shifting toward EAF and renewables-driven supply to meet decarbonization targets, a movement described as a trend reshaping customer purchasing decisions in 2026 [S1]. The wider view is that EAF capacity expansion, not greenfield blast furnace construction, defines new global rebar tonnage through 2031. For a detailed view on how EAF and downstream fabrication equipment fit into a mill, see the linear module spec map for steel mills.
Product Type and Grade Mix: Deformed Bar Holds Roughly Two-Thirds of Volume
Deformed rebar accounts for over 65% of global volume and is reinforced through thermo-mechanically treated (TMT) processing for ductility, with the deformed segment valued at USD 158.7 billion in 2024 [S5]. Mild bar remains in service for small-scale applications where its smoother surface, lower tensile strength, and lower cost remain acceptable trade-offs [S2].
Grade stratification is explicit in published segmentation: Grade 40, Grade 60, Grade 75, and Grade 80 each represent distinct demand pockets, with Grade 60 typically the high-volume default in commercial and public-infrastructure pours [S5]. Use of higher-grade deformed bar can reduce reinforcement congestion by up to 15% versus lower-grade alternatives, enabling more efficient concrete placement in seismic and high-rise applications [S5]. On the fabrication side, contractors pairing Grade 75 or Grade 80 stock with mechanized rebar benders and rebar cutters typically achieve tighter bend-radius tolerances and lower scrap rates than hand-cutting crews.
Coating and Bar Size: Plain Carbon Dominates, #4 Leads the Bar-Size Ladder

Plain carbon steel rebar is forecast to dominate global value in 2026, with galvanized and epoxy-coated variants holding smaller share pockets tied to corrosive-environment projects [S1][S3]. North American data confirms plain carbon as the leading 2025 coating segment for the region, driven by standard construction applications [S3].
By bar size, the #4 (13 mm nominal) bar leads the 2026 value ranking, a function of its near-universal use in residential slab-on-grade, light commercial footings, and grade-beam reinforcement [S1]. Larger #8 (25 mm) and above sizes serve bridge decks, high-rise columns, and heavy infrastructure where tensile load drives the spec. The widest product family sits in steel rebar and rebar categories, with rebar couplers increasingly specified at splice locations to reduce lap-length congestion on Grade 75 and Grade 80 designs.
Regional Read: APAC Carries the Volume, North America Climbs in Value
APAC is the volume engine, with the region accounting for 74.1% of 2025 global rebar value and over 50% of forecast-period incremental growth [S1][S5]. India is the named growth catalyst: the National Highway network expanded from 91,287 km in 2014 to 1,46,145 km in 2024 under the Bharatmala Pariyojana, and the country recorded USD 818.67 billion in new public-private partnership infrastructure projects in 2024 [S2].
North America runs at a smaller absolute base (USD 28.96 billion 2026 estimate) but at a faster 5.72% CAGR through 2034, with the US alone driving 85.4% of regional revenue [S3]. US Census Bureau data cited in the regional report puts the value of construction put in place at approximately USD 2 trillion in recent years, the macro tailwind for domestic rebar offtake [S3].
Competitive Landscape: Five Star Players Plus a Tier of Regional Mills
Nippon Steel Corporation (Japan), ArcelorMittal (Luxembourg), Nucor Corporation (US), Tata Steel (India), and NLMK Group (Russia) are identified as star players, defined by large-scale manufacturing, broad product portfolios, and global distribution reach [S1]. The named North American roster is more fragmented: Nucor Corporation, Gerdau, Acerinox S.A., General Foundation CSIC, and Posco SS Vina lead the regional competitive map [S3].
Below the star tier, startups and SMEs including Swan Industries (Thailand), Tubex, G. Staehle GmbH u. Co. KG, and Kian Joo Can Factory Berhad are gaining ground on the back of expanded production capacity and branded, high-strength TMT rebar offerings [S1]. Spec-driven procurement remains the gatekeeper: a stainless steel procurement brief that separates consumer discounts from industrial supplier signals is a useful parallel, since the same price-vs-spec trap applies to rebar.
Demand Drivers, Constraints, and a Criteria-Based Comparison
Three demand pillars dominate 2026 commentary: government-funded transport infrastructure (highways, metros, airports, rail), residential and commercial building growth tied to urbanization, and industrial capacity build-out for warehouses, factories, and power plants [S1][S2]. On the supply side, the binding constraints are raw material and energy price volatility, with one cited scenario flagging production-cost swings of over 20% in a single quarter, and the high initial capex of rebar manufacturing capacity [S2][S5].
A simple criteria-based comparison lines up the main product options a specifier chooses between:
<strong>Option</strong> <strong>Best fit</strong> <strong>Trade-off</strong><br> Mild steel bar Small-scale, low-tensile pours Weaker concrete bond, lower ductility [S2]<br> Deformed Grade 60 Default commercial and infrastructure Mid-tier seismic performance, widely available [S5]<br> Deformed Grade 75/80 (TMT) High-rise, seismic, heavy bridge Higher unit cost, may require couplers and qualified bending equipment [S5]<br> Galvanized or epoxy-coated Marine, deicing-salt, or aggressive soil exposure Premium price, longer lead times [S1][S3]
AI-driven process control is now a named 2026 trend: predictive maintenance to cut downtime, defect detection for strength consistency, and inventory and demand forecasting at the construction-company level [S2].
Trackable Signals and the Next Node to Watch
Three signals are worth tracking through the rest of 2026. First, EAF-vs-BOS tonnage share in the next quarterly mill disclosures, which will show whether decarbonization is converting from rhetoric to capacity. Second, US Department of Transportation and Federal Highway Administration infrastructure outlay data, which feeds directly into the 5.72% North American CAGR assumption. Third, India MoRTH quarterly highway-construction mileage reports, since the Bharatmala pipeline is the single largest named incremental demand driver in the surveyed forecasts. Cross-check any of these against rebar straightener throughput at the mill level to detect whether softening in coil quality is forcing contractors toward in-line straightening rather than mill-as-delivered material. [S2]